22nd June morning.
Update will be done in Evening.
All comments will be answered in the Evening just for today.
આજે અપડેટ સાંજે થશે
આજે કમેન્ટ ના જવાબ સાંજે મળશે
Current Weather Conditions on 21st June 2015
A Low Pressure has developed over the North East Arabian & Adjoining East Central Arabian Sea early this morning. It is now a Well Marked Low Pressure.
સુચના: હાલ સિસ્ટમ કઈ બાજુ જશે ? મારા ગામ માં વરસાદ આવશે ? તેવા સવાલો કરવા નહિ. જેટલો વધુ સમય તમારા સવાલો નો જવાબ આપવામાં વાપરીશ એટલો ઓછો સમય અપડેટ માં આપી શકીશ. માટે સહકાર આપો.
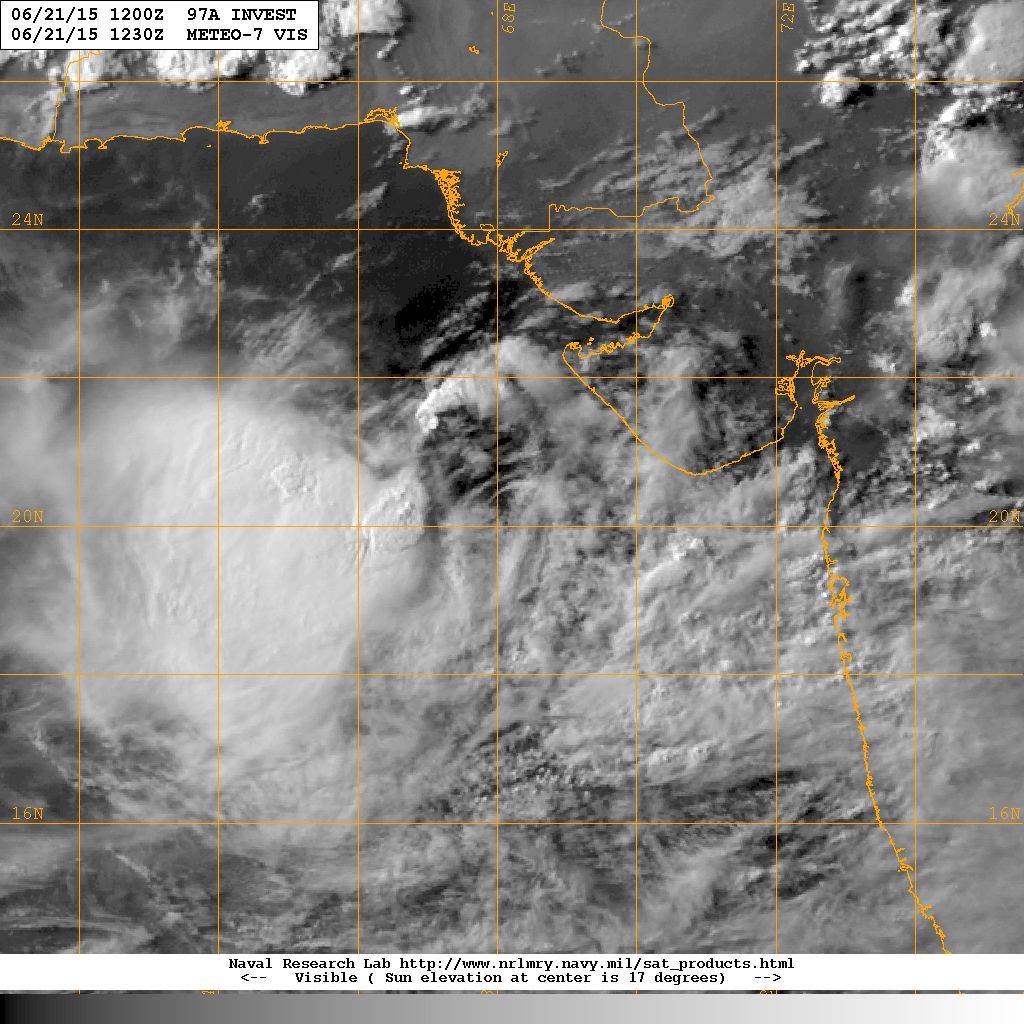
ઊત્તર પૂર્વ અને લાગુ મધ્ય પૂર્વ અરબી સમુદ્ર માં લો પ્રેસર થયું છે. આગળ જતા શું થવું છે. કઈ બાજુ જશે તે બધું હજુ ચોક્કસ નથી. 24 કલાક માં ખ્યાલ આવશે. સૌરાષ્ટ્ર ના પશ્ચિમ કિનારા થીસીસ્ટમ નું સેન્ટર હાલ્ 300 Km. દક્ષીણ પશ્ચિમે છે. ઘટ વાદળા 500 Km. માં ફેલાયેલા છે જે આ સીસ્ટમ ના સેન્ટર થી મુખ્યત્વે પશ્ચિમે છે.
ટૂકું તને ટચ : બે ફોરકાસ્ટ મોડલ માં મત મત્તાંતર છે.
પણ હાલ નું નિદાન: આ સીસ્ટમ પહેલા થોડી સૌરાષ્ટ્ર થી દૂર જશે અને પછી પાછી સૌરાષ્ટ્ર કચ્છ તરફ પરત ફરશે તેવું અનુમાન છે. 24 કલાક માં ફેર ફર હશે અપડેટ થશે.
નીચે જે લખાણ તેમજ ચાર્ટ છે તે અનુભવી લોકો માટે આપેલ છે. હવામાન ની એ બી સી શીખતા હોઈ તેના માટે નથી, માટે ઉપર ટુકું ને ટચ આપેલ છે.
There is a differing outcome to the track of this Low Pressure by the two Forecast Models GFS & ECMWF. There will be more clarity by comparing the current position of the Low Pressure center with that of the initial center of both the Forecast Models.
The core of dense clouding associated with this Low Pressure is spread over a diameter of 500 Kms. The Center of the Low Pressure is located about 300 Km. Southwest from Western Saurashtra Coast. This means that the clouding is mainly to the West of the System Center.
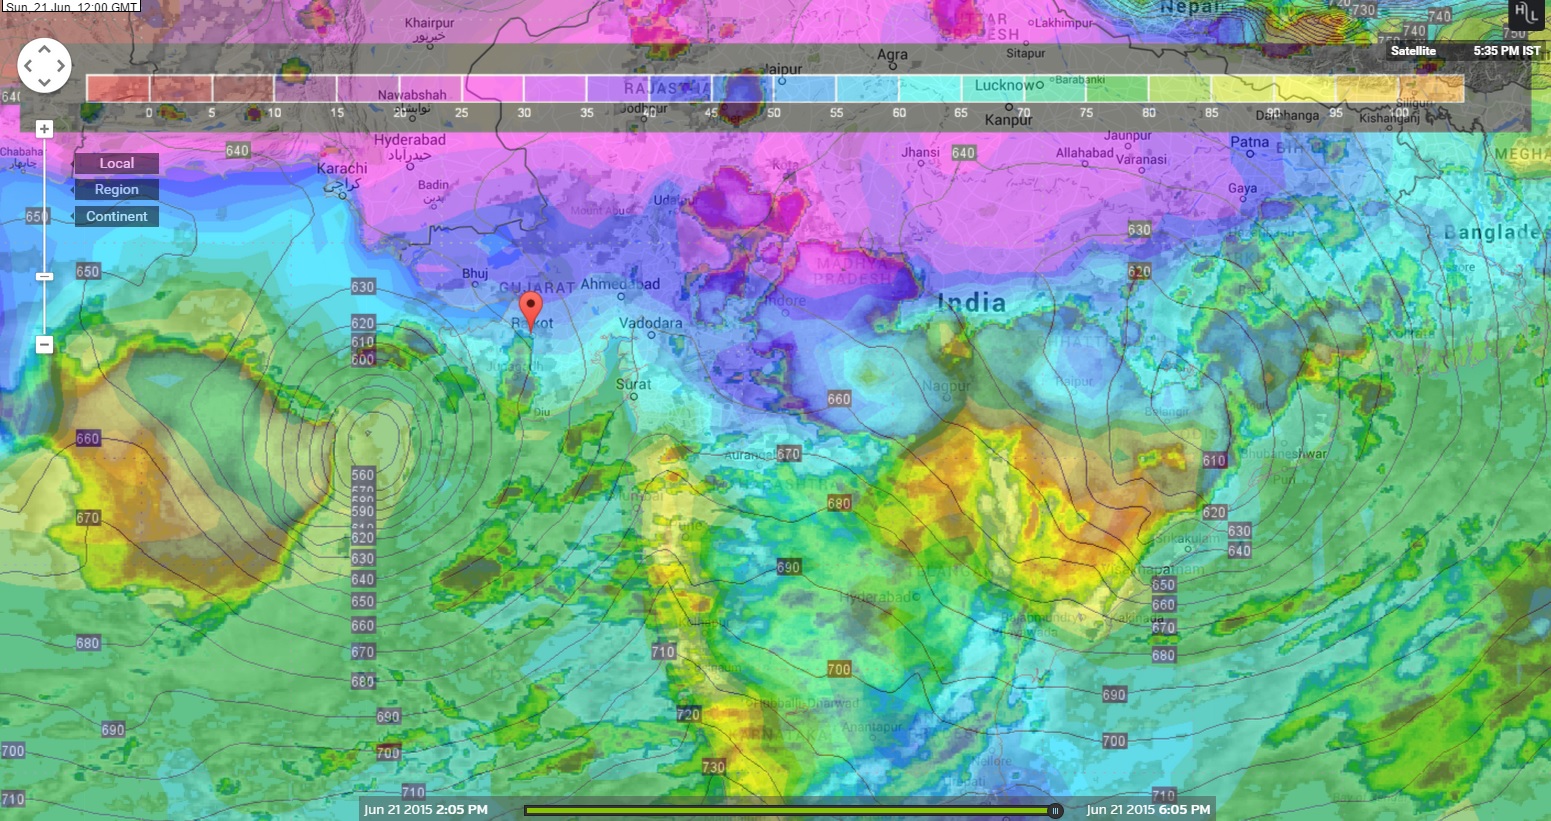
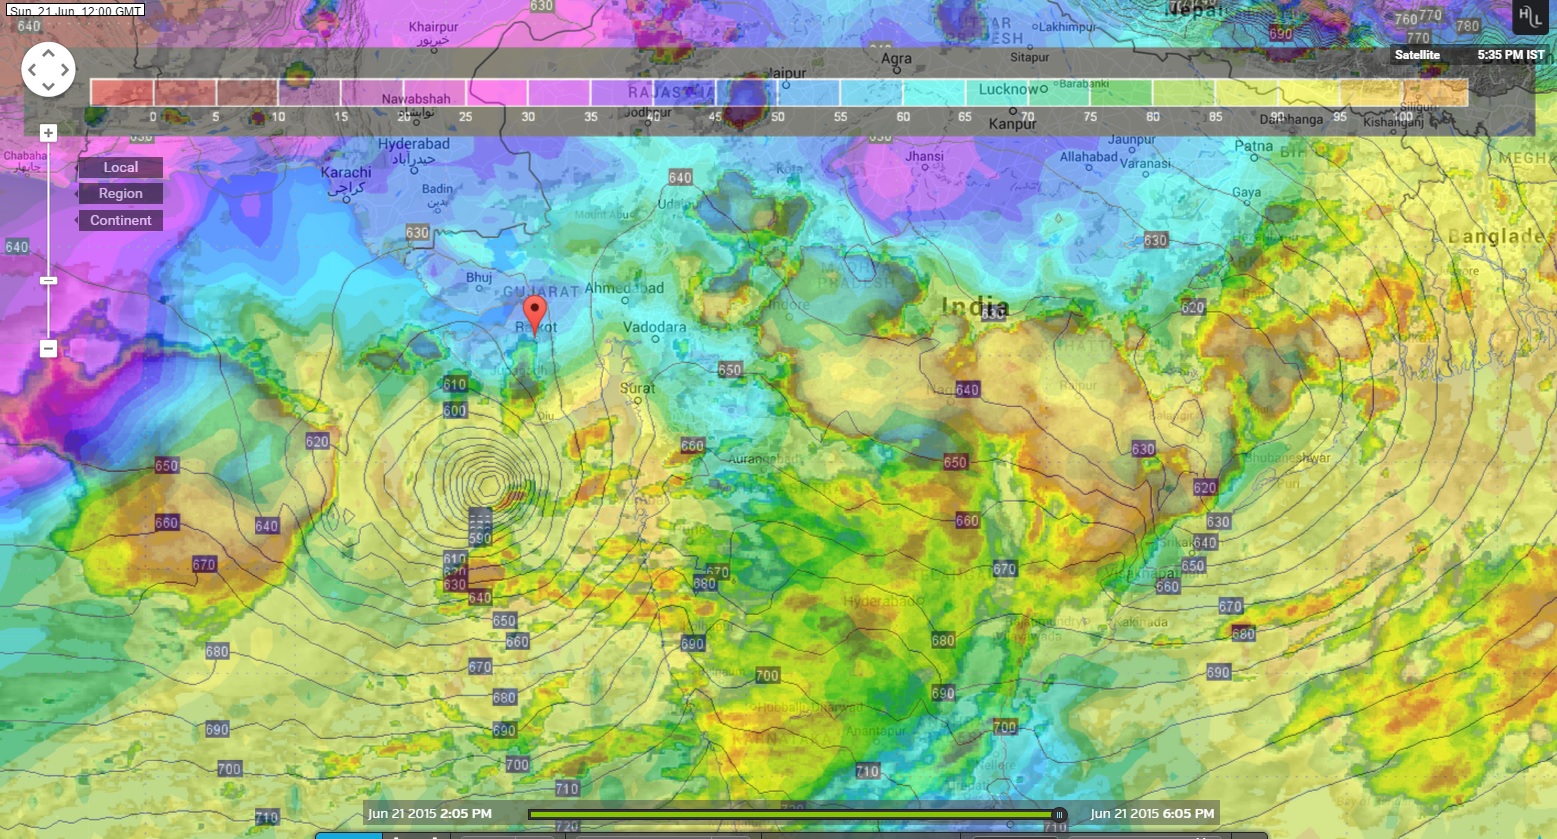
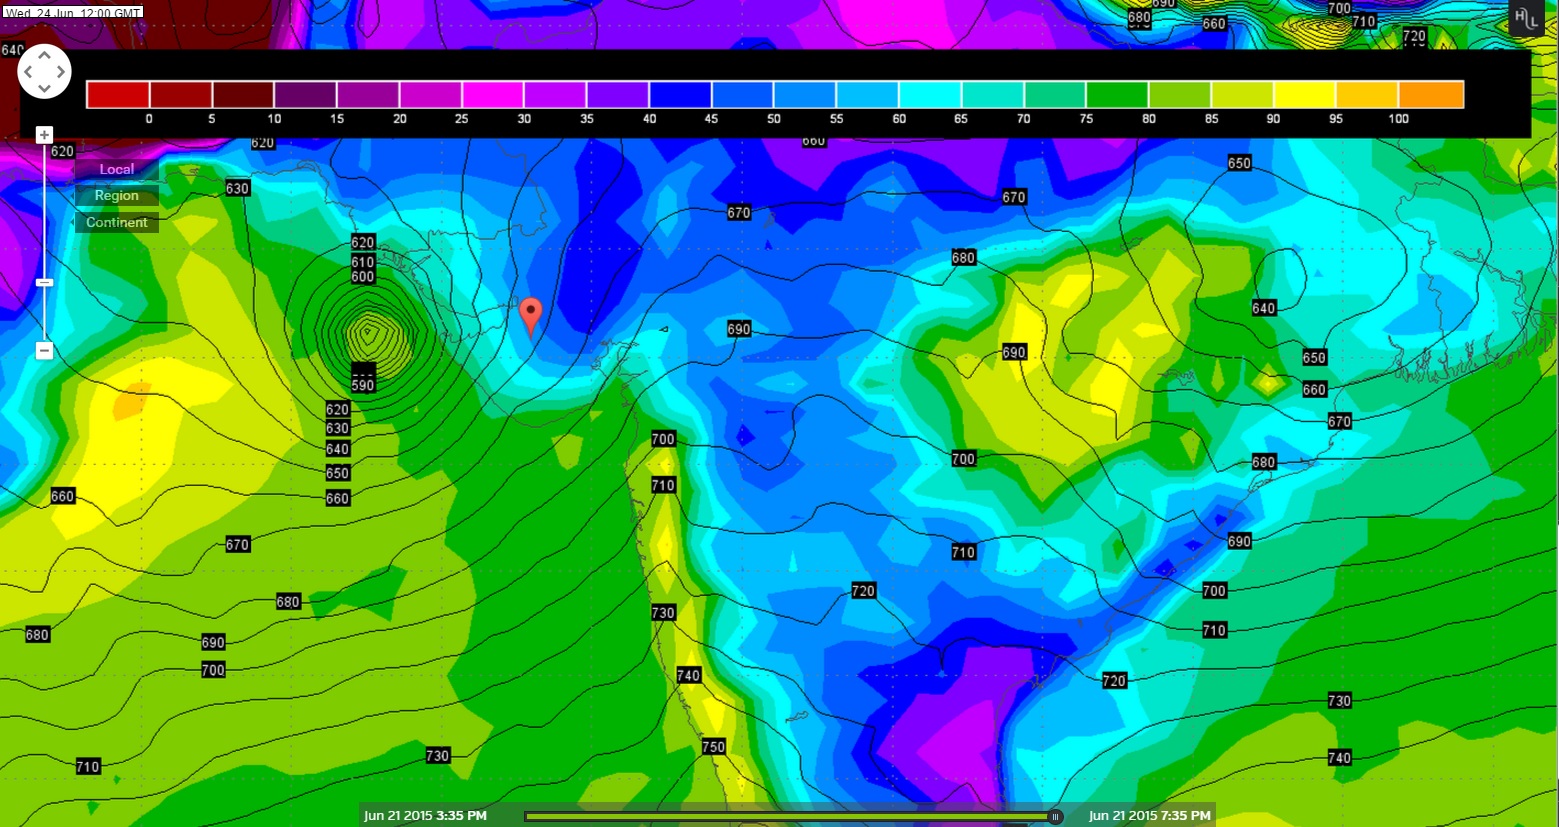
Here is a comparison of the two Forecast Modes viz. GFS & ECMWF. The maps below are superimposed with Clouding and the initial conditions of 925 hPa chart for both the GFS & ECMWF models. It is very clear that the System center estimate of ECMWF 925 hPa chart seems to be off the reality with clouding. The GFS Model has the initial System Center close to the actual System Center and the vicinity of the dense core of clouding that can be seen to the right of the System Center in 925 hPa chart.
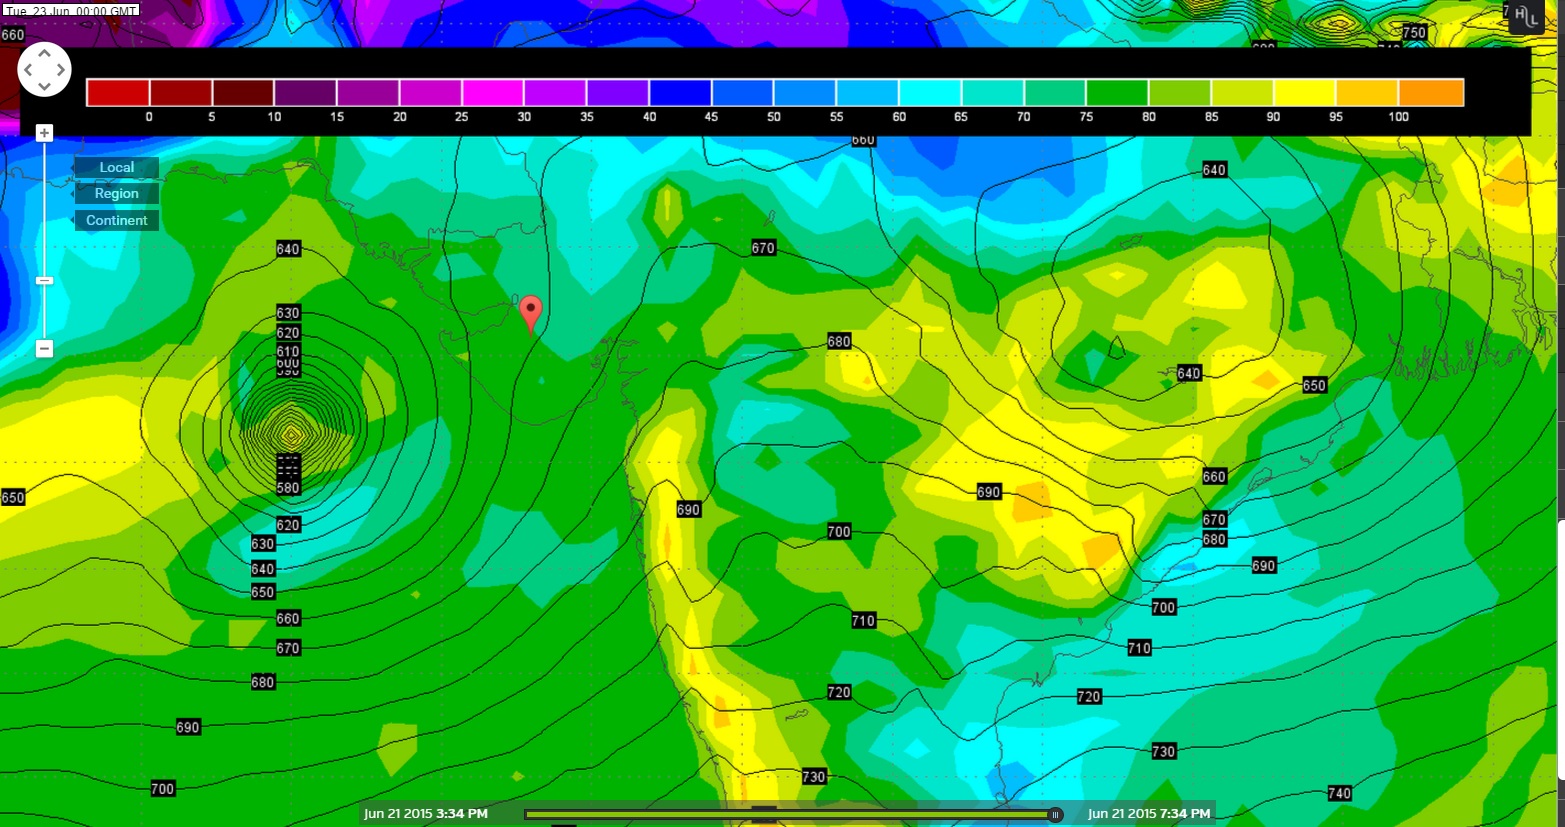
Conclusion: There is high probability that GFS model outcome would prevail. However, further monitoring a few forecast runs will make things more clear.
Wunderground GFS 925 hPa Chart Valid 21st June 2015 @ 1200 UTC
Wunderground ECMWF 925 hPa Chart Valid 21st June 2015 @ 1200 UTC
Wunderground GFS 925 hPa Chart Valid 23rd June 2015 @ 0000 UTC
Wunderground GFS 925 hPa Chart Valid 24th June 2015 @ 1200 UTC
From IMD Inference on 21st June issued at 2030 IST based on observations of 1730 IST:
The low pressure area over northeast Arabian sea off Gujarat now lies as a well marked low pressure area over Northeast and adjoining East Central Arabian Sea. The system is likely to concentrated into a depression during next 24 hour.
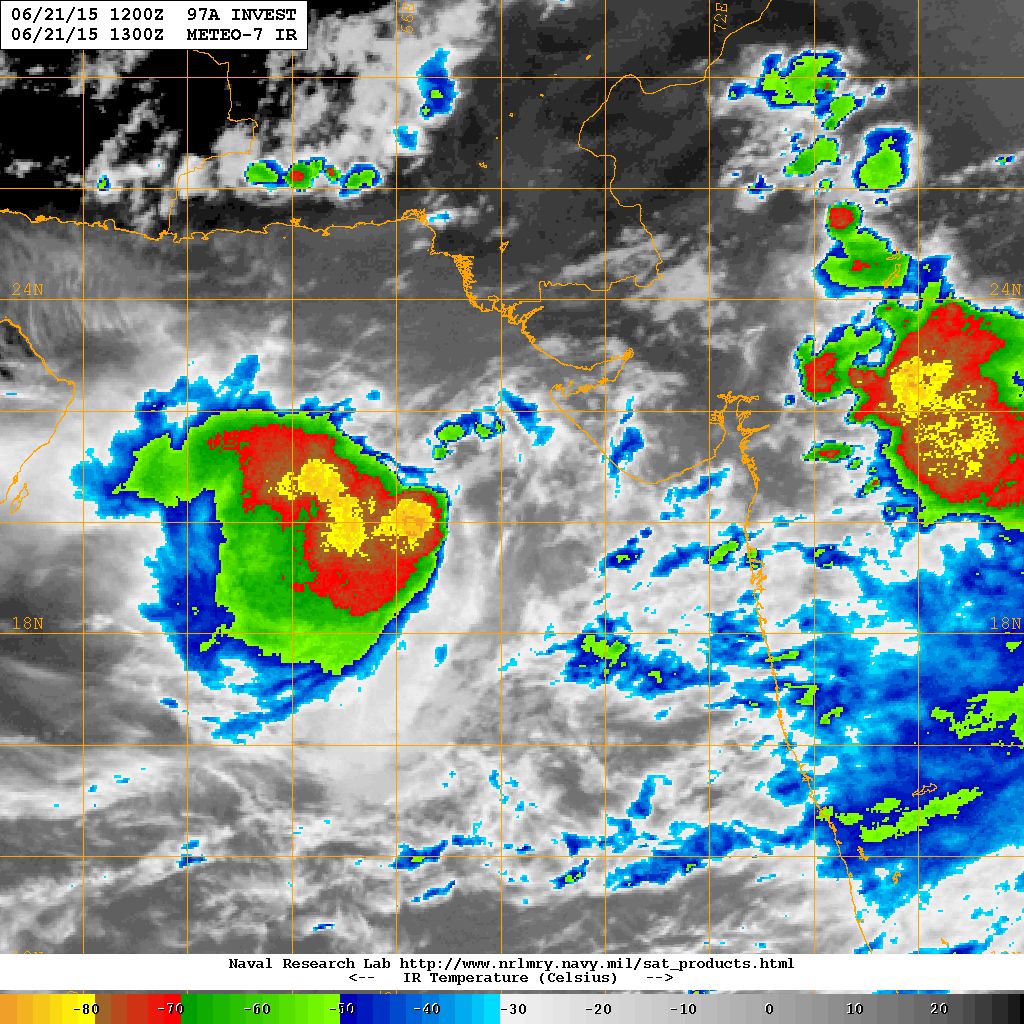
As per NRL: 97A.INVEST first appeared over the North East & adjoining East Central Arabian Sea on 20-06-2015 @ 2130 UTC.
NRL IR Satellite Image on 21st June 2015 @ 1300 UTC ( 6.30 pm. IST)
NRL Visible Satellite Image on 21st June 2015 @ 1230 UTC ( 06.00 pm. IST)