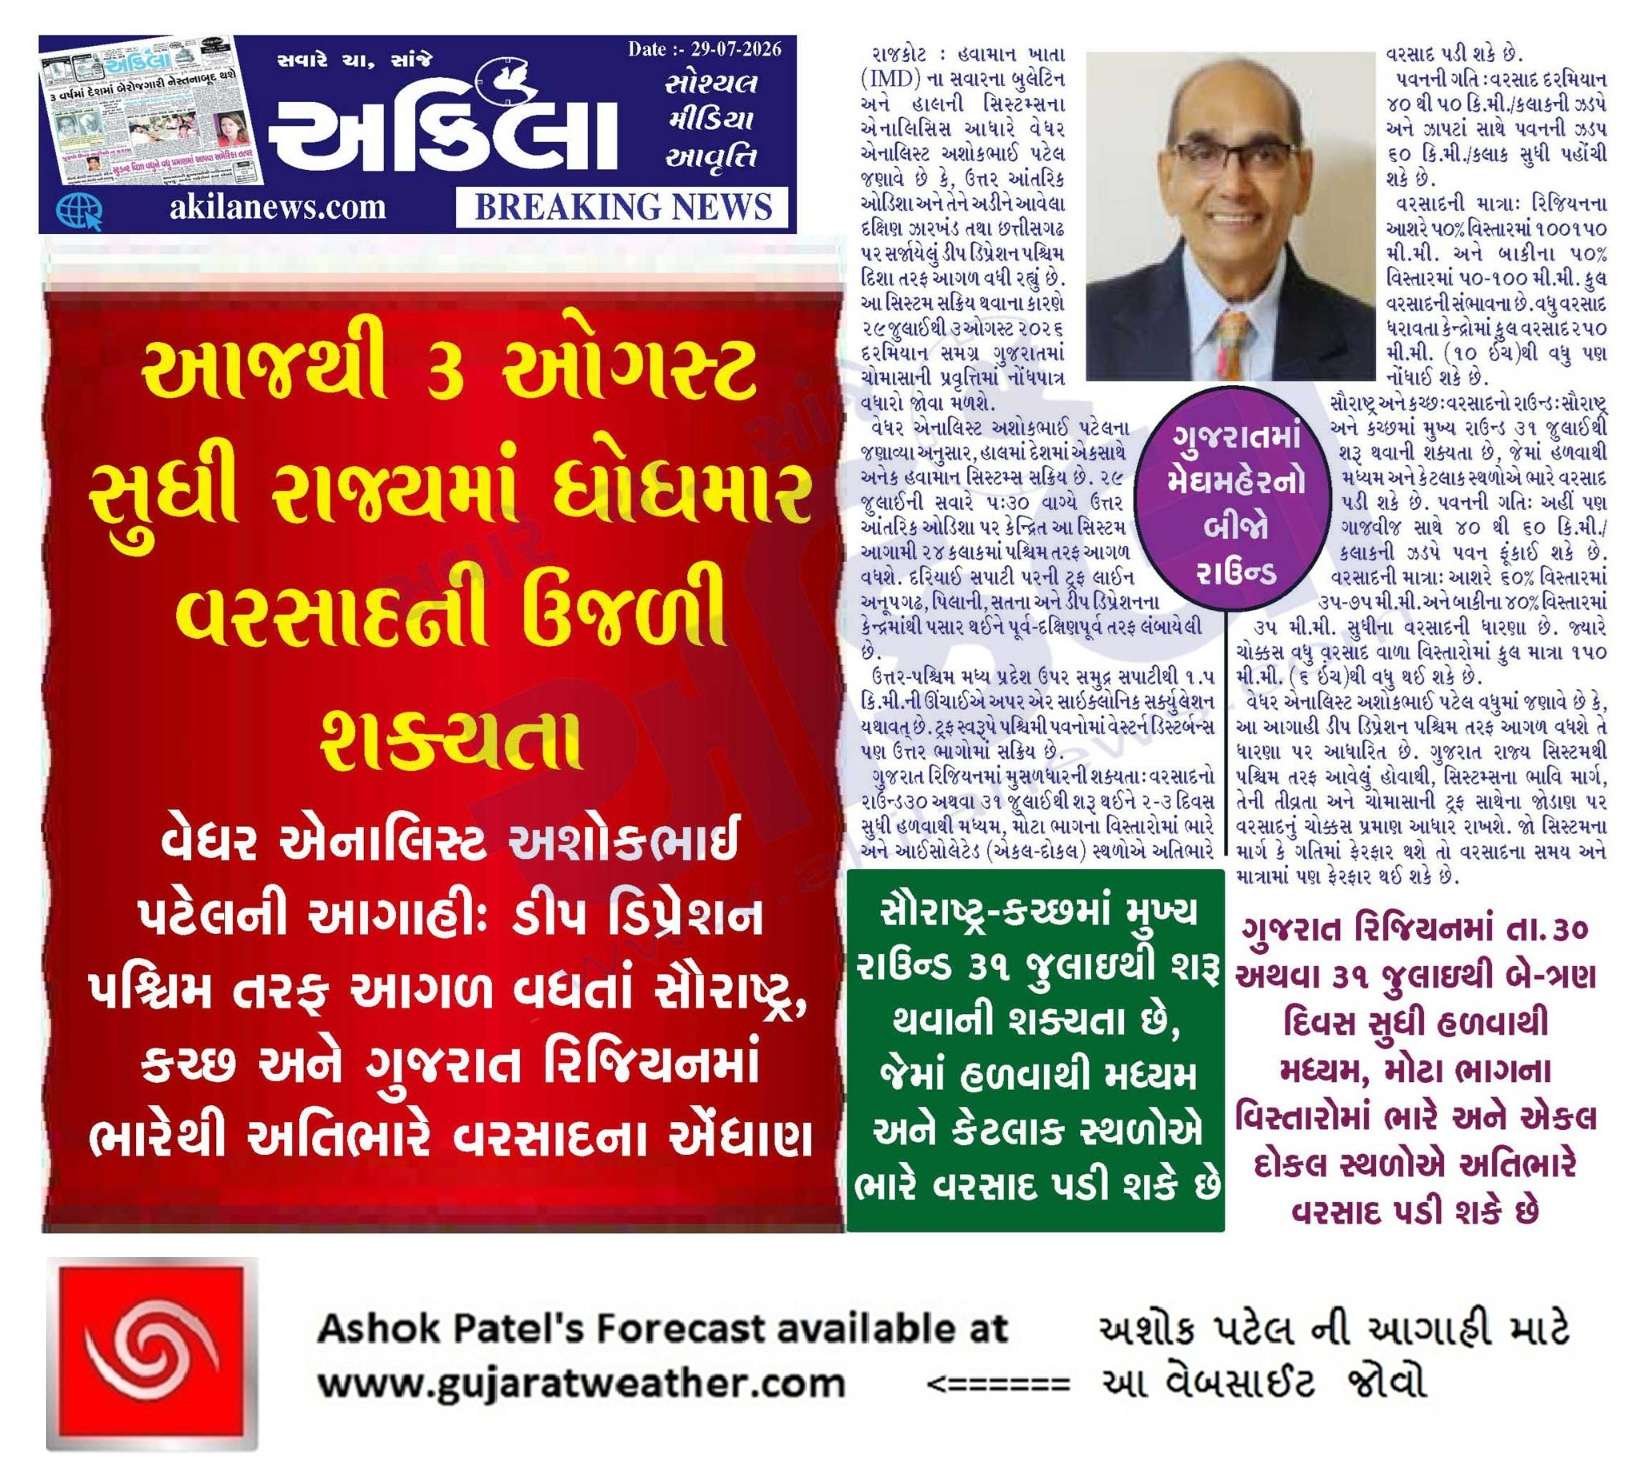
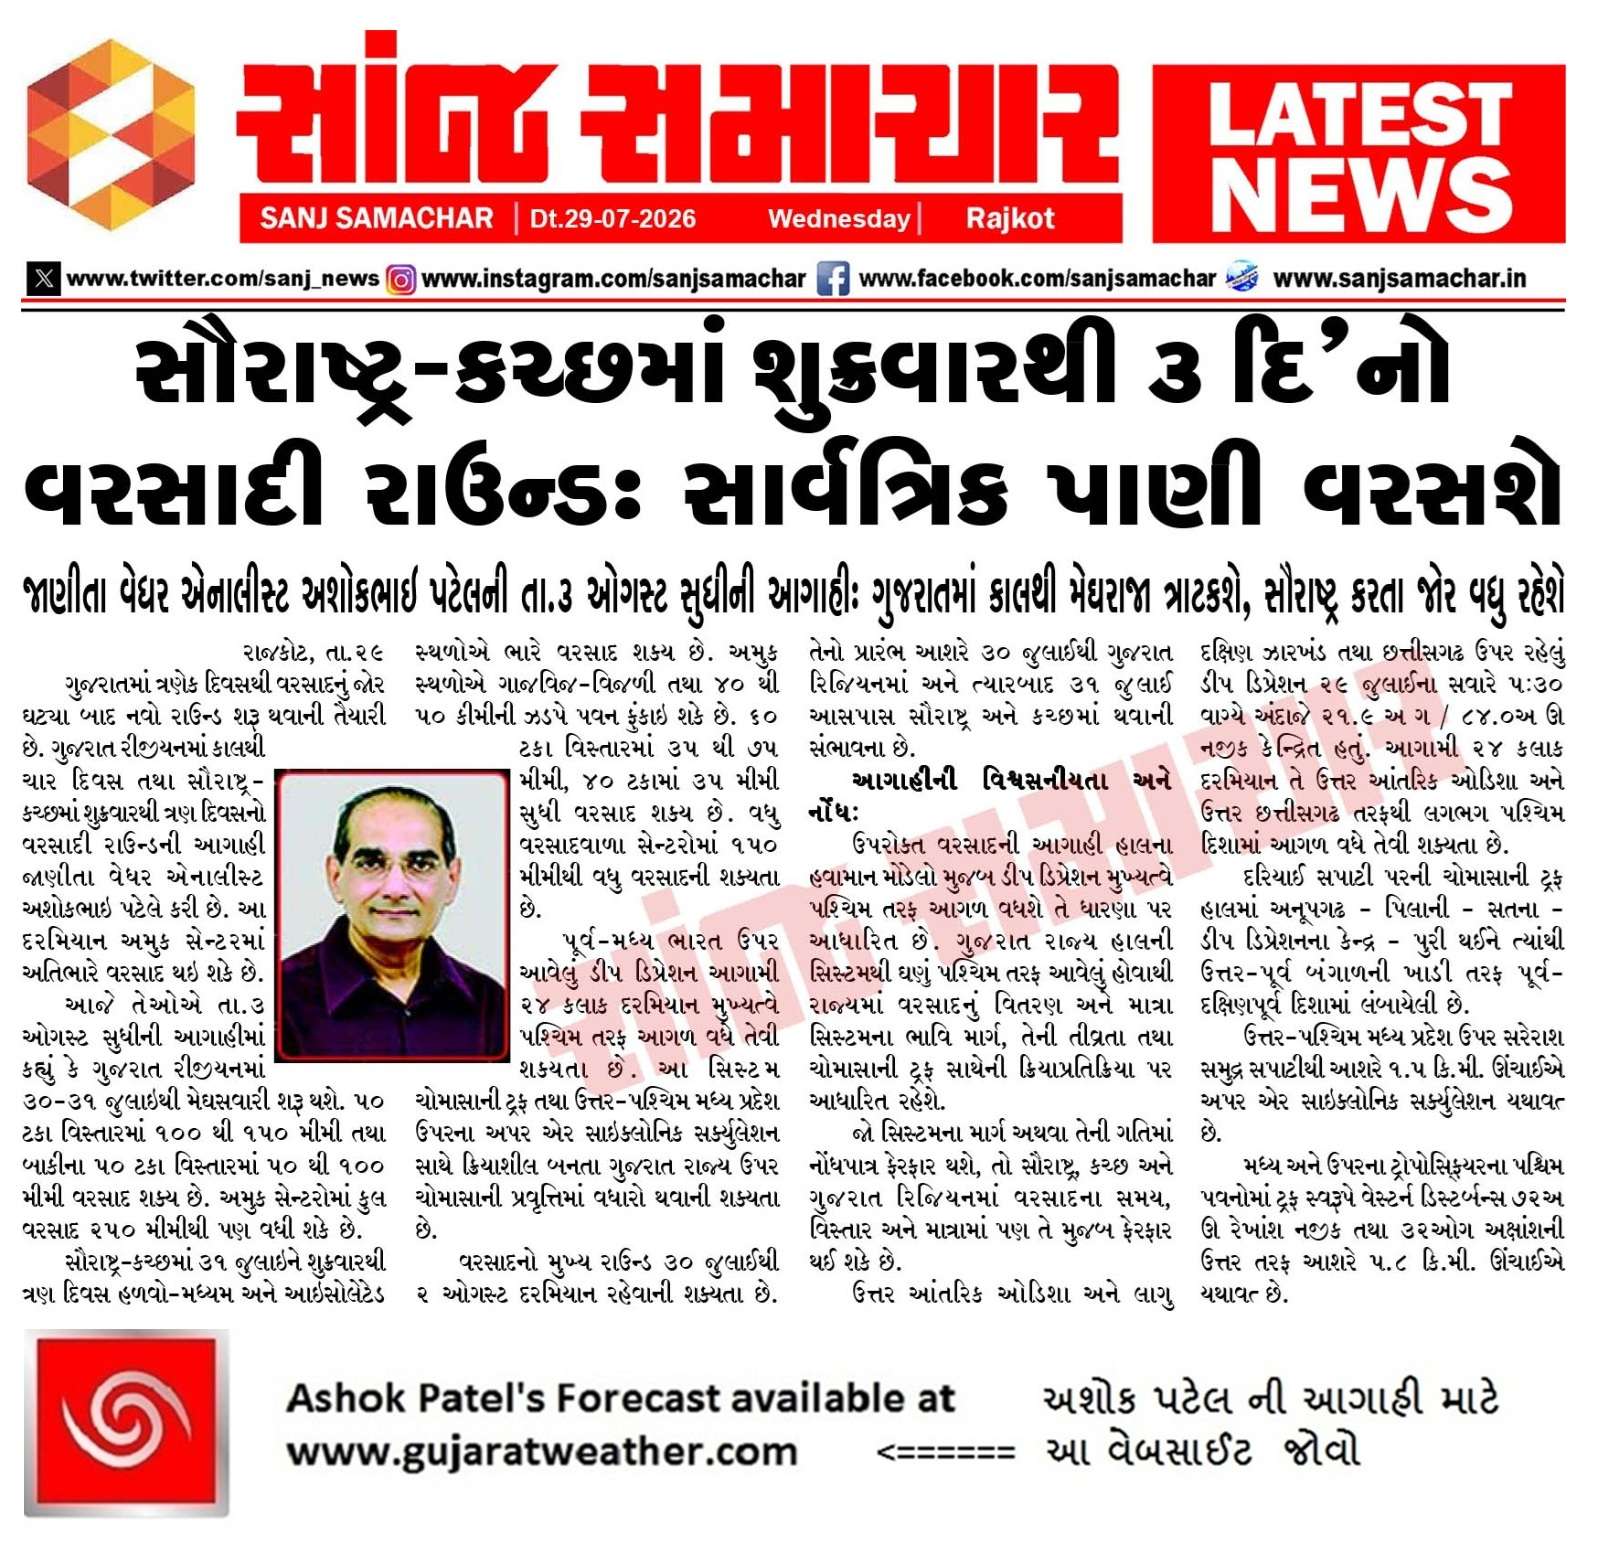
Deep Depression To Track Mainly Westwards – Bright Chance For Saurashtra Kutch & Gujarat To Receive Good Round Of Rainfall During 29th-3rd August 2026
ડીપ ડિપ્રેશન મુખ્યત્વે પશ્ચિમ તરફ આગળ વધશે – 29 જુલાઈથી 3 ઓગસ્ટ 2026 દરમિયાન સૌરાષ્ટ્ર, કચ્છ અને ગુજરાત રિજિયનમાં સારા વરસાદની ઉજળી શક્યતા
Some Important Weather Parameters (IMD Morning Bulletin – 29th July 2026)
- Deep Depression: The Deep Depression over north interior Odisha and adjoining south Jharkhand & Chhattisgarh remained over the region at 0530 IST on 29th July, centred near 21.9°N / 84.0°E. It is expected to move nearly westwards across north interior Odisha and north Chhattisgarh during the next 24 hours.
- Monsoon Trough: The Monsoon trough at mean sea level extends from Anupgarh – Pilani – Satna – the centre of the Deep Depression – Puri, and then east-southeastwards towards the Northeast Bay of Bengal.
- Upper Air Cyclonic Circulation: An upper air cyclonic circulation persists over northwest Madhya Pradesh at around 1.5 km above mean sea level.
- Western Disturbance: A Western Disturbance as a trough in the middle and upper tropospheric westerlies persists along 72°E, north of 32°N, at around 5.8 km above mean sea level.
Weather Forecast for Saurashtra, Gujarat & Kutch (29th July to 3rd August 2026)
Gujarat Region:
Rainfall Activity
- Fairly Widespread to Widespread light to moderate rainfall with heavy rainfall at many places and very heavy rainfall at isolated places during the main spell for two/three days starting around 30th/31st July.
- Isolated to Scattered light to moderate rainfall during the remaining period.
Thunderstorm / Lightning / Gusty Winds
- Isolated thunderstorm, lightning and gusty winds (40–50 kmph, gusting to 60 kmph): during the main spell.
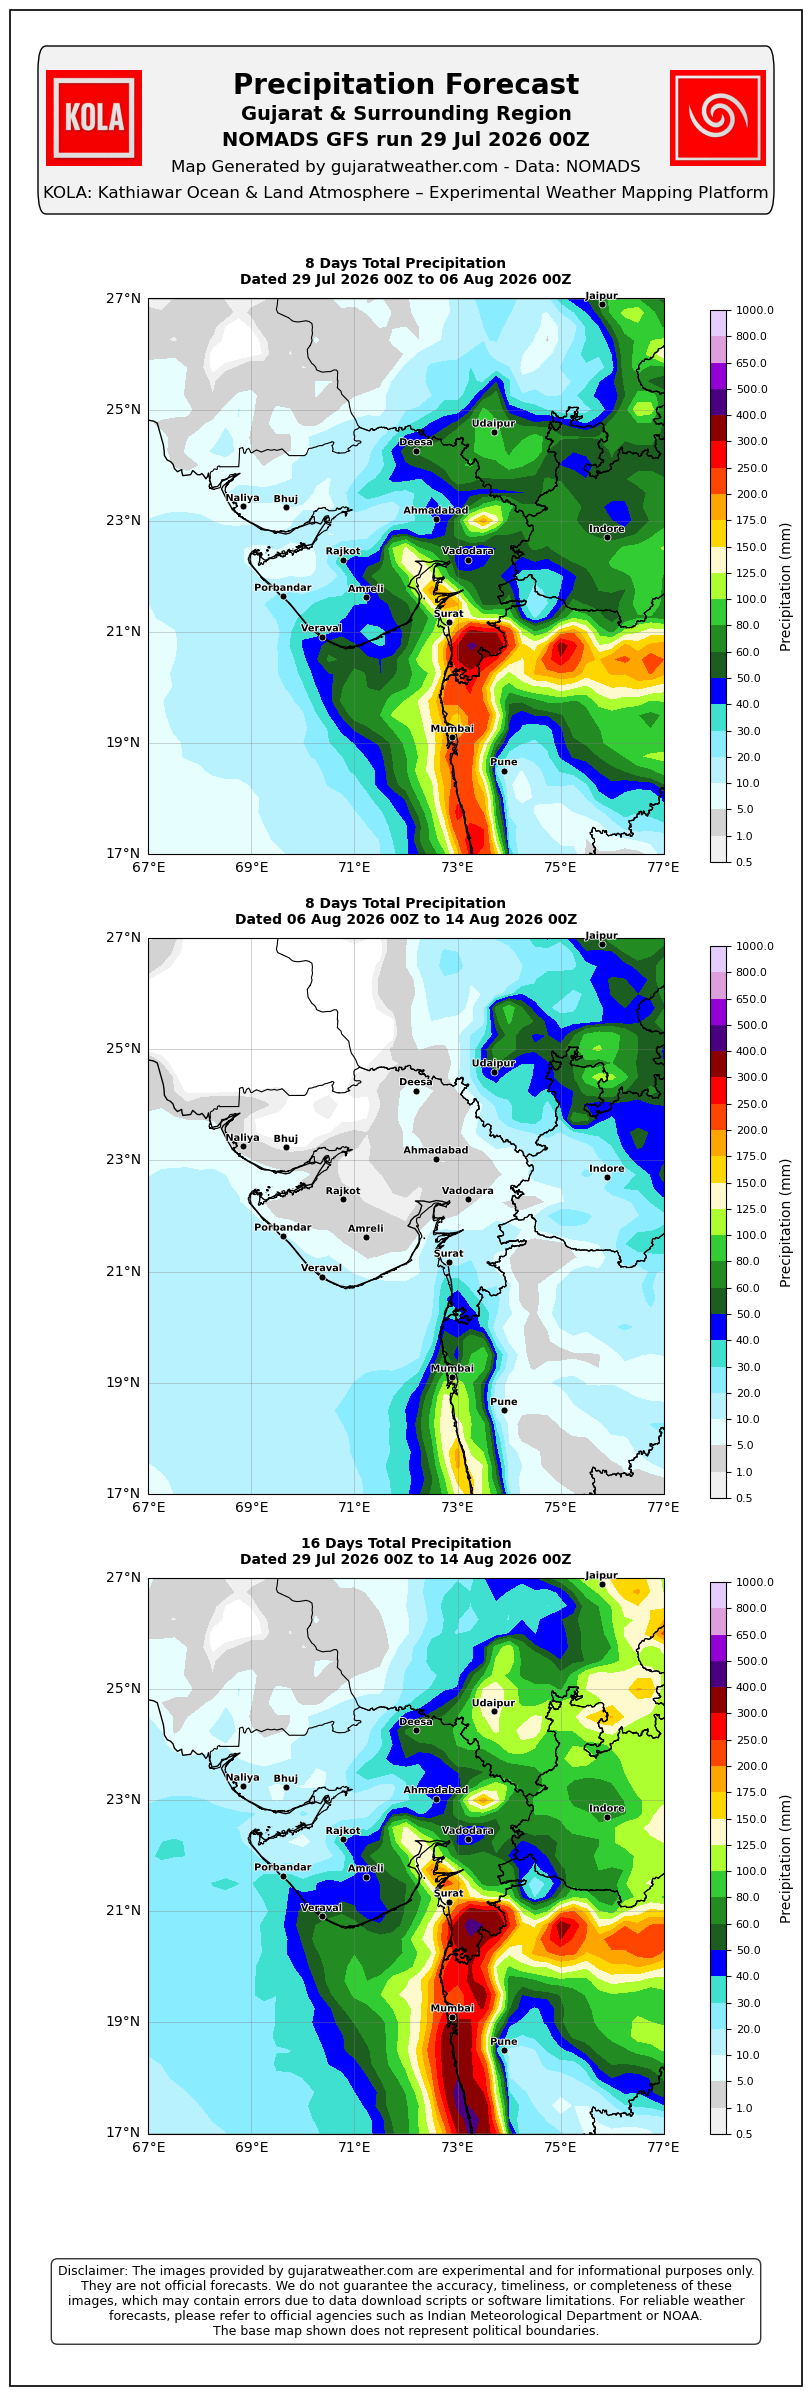
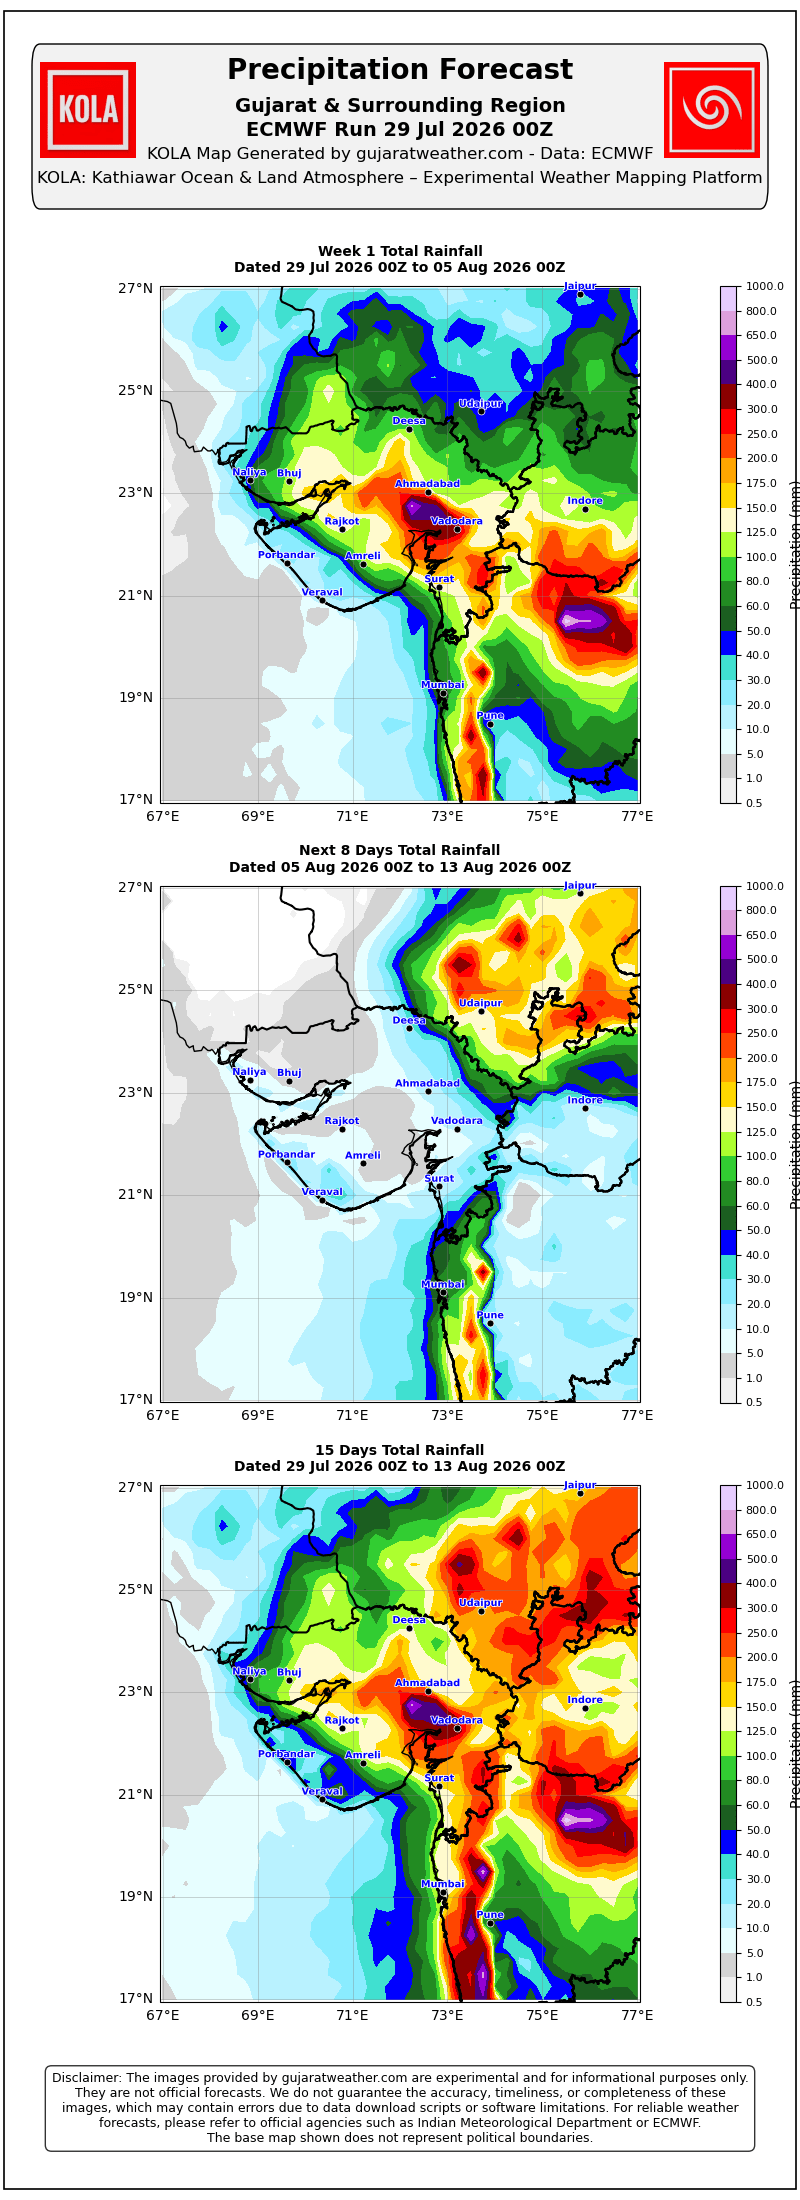
Cumulative Rainfall Forecast (29th July – 3rd August)
- Around 50% of the area: 100–150 mm
- Remaining 50% of the area: 50–100 mm
- A few high rainfall centers could receive cumulative rainfall exceeding 250 mm.
Saurashtra & Kutch:
Rainfall Activity
- Fairly Widespread to Widespread light to moderate rainfall with isolated heavy rainfall during the main spell starting around 31st July.
- Isolated to Scattered light to moderate rainfall during the remaining period.
Thunderstorm / Lightning / Gusty Winds
- Isolated thunderstorm, lightning and gusty winds (40–50 kmph, gusting to 60 kmph) during the main spell.
Cumulative Rainfall Forecast (29th July – 3rd August)
- Around 60% of the area: 35–75 mm
- Remaining 40% of the area: Up to 35 mm
- A few high rainfall centers could receive cumulative rainfall exceeding 150 mm.
Summary
The Deep Depression over east-central India is expected to track mainly westwards during the next 24 hours. As it interacts with the Monsoon trough, the upper air cyclonic circulation over northwest Madhya Pradesh, the monsoon activity is expected to strengthen over Gujarat State.
The main spell of rainfall is expected from 30th July to 2nd August, beginning over Gujarat Region around 30th July and extending to Saurashtra & Kutch from around 31st July.
Gujarat Region is likely to receive the more widespread and heavier rainfall, with many areas receiving 100–150 mm cumulatively during the forecast period and a few high rainfall centers exceeding 250 mm.
Saurashtra & Kutch are expected to receive a good round of rainfall, with more than around half the region likely to receive 35–75 mm cumulatively, while a few high rainfall centers could exceed 150 mm.
Forecast Confidence & Note
The above rainfall forecast is based on the Deep Depression maintaining a predominantly westward track as presently indicated by weather models. Since Gujarat State is located well west of the current system, the distribution and quantum of rainfall will depend on the system’s future track, intensity and interaction with the monsoon trough. Any significant deviation in the track or speed of the system could result in corresponding changes in the timing, distribution and rainfall amounts over Saurashtra, Kutch and Gujarat Region.
ડીપ ડિપ્રેશન મુખ્યત્વે પશ્ચિમ તરફ આગળ વધશે – 29 જુલાઈથી 3 ઓગસ્ટ 2026 દરમિયાન સૌરાષ્ટ્ર, કચ્છ અને ગુજરાત રિજિયનમાં સારા વરસાદની ઉજળી શક્યતા
IMD સવારના બુલેટિન (29 જુલાઈ 2026) મુજબના કેટલાક મહત્વના હવામાન પરિબળો:
ડીપ ડિપ્રેશન:
ઉત્તર આંતરિક ઓડિશા અને લાગુ દક્ષિણ ઝારખંડ તથા છત્તીસગઢ ઉપર રહેલું ડીપ ડિપ્રેશન 29 જુલાઈના સવારે 5:30 વાગ્યે અંદાજે 21.9°N / 84.0°E નજીક કેન્દ્રિત હતું. આગામી 24 કલાક દરમિયાન તે ઉત્તર આંતરિક ઓડિશા અને ઉત્તર છત્તીસગઢ તરફથી લગભગ પશ્ચિમ દિશામાં આગળ વધે તેવી શક્યતા છે.
ચોમાસાની ટ્રફ (Monsoon Trough):
દરિયાઈ સપાટી પરની ચોમાસાની ટ્રફ હાલમાં અનૂપગઢ – પિલાની – સતના – ડીપ ડિપ્રેશનના કેન્દ્ર – પુરી થઈને ત્યાંથી ઉત્તર-પૂર્વ બંગાળની ખાડી તરફ પૂર્વ-દક્ષિણપૂર્વ દિશામાં લંબાયેલી છે.
અપર એર સાઇક્લોનિક સર્ક્યુલેશન:
ઉત્તર-પશ્ચિમ મધ્ય પ્રદેશ ઉપર સરેરાશ સમુદ્ર સપાટીથી આશરે 1.5 કિ.મી. ઊંચાઈએ અપર એર સાઇક્લોનિક સર્ક્યુલેશન યથાવત્ છે.
વેસ્ટર્ન ડિસ્ટર્બન્સ:
મધ્ય અને ઉપરના ટ્રોપોસ્ફિયરના પશ્ચિમી પવનોમાં ટ્રફ સ્વરૂપે વેસ્ટર્ન ડિસ્ટર્બન્સ 72°E રેખાંશ નજીક તથા 32°N અક્ષાંશની ઉત્તર તરફ આશરે 5.8 કિ.મી. ઊંચાઈએ યથાવત્ છે.
સૌરાષ્ટ્ર, ગુજરાત રિજિયન અને કચ્છ માટે હવામાન આગાહી (29 જુલાઈથી 3 ઓગસ્ટ 2026)
ગુજરાત રિજિયન:
વરસાદની પ્રવૃત્તિ:
- મુખ્ય રાઉન્ડ દરમિયાન (આશરે 30/31 જુલાઈથી શરૂ થઈ બે/ત્રણ દિવસ) હળવાથી મધ્યમ વરસાદ, ઘણા વિસ્તારોમાં ભારે વરસાદ તેમજ આઇસોલેટેડ સ્થળોએ અતિ ભારે વરસાદની શક્યતા.
- બાકીના સમયગાળા દરમિયાન આઇસોલેટેડથી સ્કેટર્ડ હળવાથી મધ્યમ વરસાદની શક્યતા.
ગાજવીજ / વીજળી / પવન:
- મુખ્ય રાઉન્ડ દરમિયાન આઇસોલેટેડ ગાજવીજ, વીજળી તથા 40–50 કિ.મી./કલાકની ઝડપે ફૂંકાતા અને ઝોકા સાથે 60 કિ.મી./કલાક સુધી પહોંચતા પવનોની શક્યતા.
વરસાદ ની કુલ માત્રા ની આગાહી (29 જુલાઈ – 3 ઓગસ્ટ):
- આશરે 50% વિસ્તારમાં: 100–150 મી.મી.
- બાકીના 50% વિસ્તારમાં: 50–100 મી.મી.
- વધુ વરસાદ વાળા કેન્દ્રો માં વરસાદ ની કુલ માત્રા 250 મી.મી.થી વધુ થઈ શકે છે.
સૌરાષ્ટ્ર અને કચ્છ:
વરસાદની પ્રવૃત્તિ
- મુખ્ય રાઉન્ડ (આશરે 31 જુલાઈથી શરૂ) દરમિયાન હળવાથી મધ્યમ વરસાદ, તેમજ આઇસોલેટેડ સ્થળોએ ભારે વરસાદની શક્યતા.
- બાકીના સમયગાળા દરમિયાન આઇસોલેટેડથી સ્કેટર્ડ હળવાથી મધ્યમ વરસાદની શક્યતા.
ગાજવીજ / વીજળી / પવન
- મુખ્ય રાઉન્ડ દરમિયાન આઇસોલેટેડ ગાજવીજ, વીજળી તથા 40–50 કિ.મી./કલાકની ઝડપે ફૂંકાતા અને ઝોકા સાથે 60 કિ.મી./કલાક સુધી પહોંચતા પવનોની શક્યતા.
વરસાદ ની કુલ માત્રા ની આગાહી (29 જુલાઈ – 3 ઓગસ્ટ)
- આશરે 60% વિસ્તારમાં: 35–75 મી.મી.
- બાકીના 40% વિસ્તારમાં: 35 મી.મી. સુધી
- વધુ વરસાદ વાળા કેન્દ્રો માં વરસાદ ની કુલ માત્રા 150 મી.મી.થી વધુ થઈ શકે છે.
સારાંશ:
પૂર્વ-મધ્ય ભારત ઉપર આવેલું ડીપ ડિપ્રેશન આગામી 24 કલાક દરમિયાન મુખ્યત્વે પશ્ચિમ તરફ આગળ વધે તેવી શક્યતા છે. આ સિસ્ટમ ચોમાસાની ટ્રફ તથા ઉત્તર-પશ્ચિમ મધ્ય પ્રદેશ ઉપરના અપર એર સાઇક્લોનિક સર્ક્યુલેશન સાથે ક્રિયાશીલ બનતા ગુજરાત રાજ્ય ઉપર ચોમાસાની પ્રવૃત્તિમાં વધારો થવાની શક્યતા છે.
વરસાદનો મુખ્ય રાઉન્ડ 30 જુલાઈથી 2 ઓગસ્ટ દરમિયાન રહેવાની શક્યતા છે. તેનો પ્રારંભ આશરે 30 જુલાઈથી ગુજરાત રિજિયનમાં અને ત્યારબાદ 31 જુલાઈ આસપાસ સૌરાષ્ટ્ર અને કચ્છમાં થવાની સંભાવના છે.
ગુજરાત રિજિયનમાં વધુ વ્યાપક અને ભારે વરસાદ થવાની શક્યતા છે. ઘણા વિસ્તારોમાં 100–150 મી.મી. જેટલો કુલ વરસાદ નોંધાઈ શકે છે, જ્યારે વધુ વરસાદ વાળા કેન્દ્રો માં વરસાદ ની કુલ માત્રા 250 મી.મી.થી વધુ થઈ શકે છે.
સૌરાષ્ટ્ર અને કચ્છમાં પણ સારા વરસાદની શક્યતા છે. આશરે અડધા થી વધુ વિસ્તારમાં 35–75 મી.મી. કુલ વરસાદ થવાની શક્યતા છે. જ્યારે વધુ વરસાદ વાળા કેન્દ્રો માં વરસાદ ની કુલ માત્રા 150 મી.મી.થી વધુ થઈ શકે છે.
આગાહીની વિશ્વસનીયતા અને નોંધ:
ઉપરોક્ત વરસાદની આગાહી હાલના હવામાન મોડેલો મુજબ ડીપ ડિપ્રેશન મુખ્યત્વે પશ્ચિમ તરફ આગળ વધશે તે ધારણા પર આધારિત છે. ગુજરાત રાજ્ય હાલની સિસ્ટમથી ઘણું પશ્ચિમ તરફ આવેલું હોવાથી રાજ્યમાં વરસાદનું વિતરણ અને માત્રા સિસ્ટમના ભાવિ માર્ગ, તેની તીવ્રતા તથા ચોમાસાની ટ્રફ સાથેની ક્રિયાપ્રતિક્રિયા પર આધારિત રહેશે.
જો સિસ્ટમના માર્ગ અથવા તેની ગતિમાં નોંધપાત્ર ફેરફાર થશે, તો સૌરાષ્ટ્ર, કચ્છ અને ગુજરાત રિજિયનમાં વરસાદના સમય, વિસ્તાર અને માત્રામાં પણ તે મુજબ ફેરફાર થઈ શકે છે.
Caution: Please refer/rely on IMD/RSMC Bulletins/Advisories for Storms & Weather related matter.
સાવચેતી: સ્ટોર્મ કે હવામાન અંગે ની માહિતી માટે ભારતીય હવામાન ખાતા/ગવર્મેન્ટ ના બુલેટીન/સુચના પર નિર્ભર રહેવું.
Read Comment Policy – કમેન્ટ માટે માર્ગદર્શન વાંચો
How To Upload Profile Picture For WordPress – વર્ડપ્રેસ માં પ્રોફાઈલ પિક્ચર કેમ રાખવું
Forecast In Akila Daily Dated 29thJuly 2026
Forecast In Sanj Samachar Daily Dated 29th July 2026