20th April 2016
Here is a discussion about the effects of NOAA introduction of ERSST.v4.
Later part deals with the latest status of the current El Nino event.
Current status: A strong El Nino which is now declining.
NOAA introduced new version ERSST.v4 from June 2015 instead of their earlier version ERSST.v3b SST departures, resulting in changes to many historical ENSO events including the current El Nino event (El Nino, La Nina, Enso Neutral).
As an example see how it has affected the current El Nino event. We know that a Full fledged El Nino was confirmed at the end of March 2015 when the five consecutive 3 month running mean based on ERSST.v3b SST anomalies in the Niño 3.4 region (5oN-5oS, 120o-170oW) had ONI index of +0.5 C or higher. See my last year’s update of 7th April 2015 part of it reproduced in bold here under:
El Nino Status on 7th April 2015 (Last Year)
Full fledged El Nino was confirmed only at the end of March 2015 when the five consecutive 3 monthly seasons had ONI index of 0.5 C or higher. Incidentally it has barely made it to a full fledged El nino. The March SST for Nino 3-4 region is 27.72 C. If however, this SST was a wee bit lower at 27.68 C ( a difference of 0.04 C only), the ONI Index for JFM would have been 0.4 C and the El Nino would have gone bust (the fifth consecutive 3 monthly season would not have qualified for El Nino).
The above points to be kept in mind and since ONI is always reported with only one decimal, yes we have an El Nino !!!
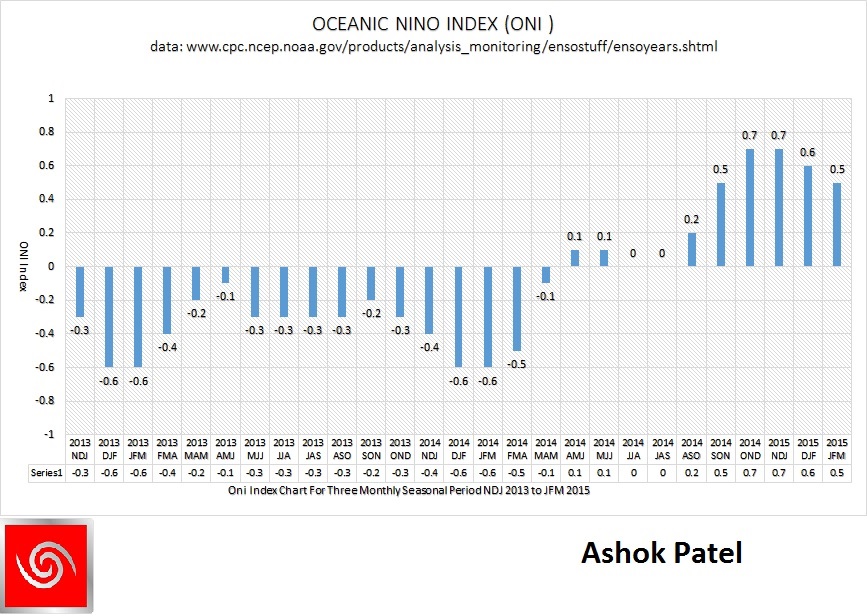
Last Two Years Oceanic Nino Index (ONI) Graph showing a Weak El Nino at the end of March 2015
(Now gone bust due to introduction of ERSST.v4 as shown in second graph)
The ONI is based on SST departures from average in the Niño 3.4 region, and is a principal measure for monitoring, assessing, and predicting ENSO. Defined as the three-month running-mean SST departures in the Niño 3.4 region. Departures were based on ERSST.v3b till June 2015 and from then on wards are now based on a set of improved homogeneous historical SST analyses (Extended Reconstructed SST – ERSST.v4). The SST reconstruction methodology is described in Huang et al., 2015, J. Climate, vol. 28, 911-930.).
NOAA Operational Definitions for El Niño and La Niña El Niño: characterized by a positive ONI greater than or equal to +0.5ºC. La Niña: characterized by a negative ONI less than or equal to -0.5ºC. By historical standards, to be classified as a full-fledged El Niño or La Niña episode, these thresholds must be exceeded for a period of at least 5 consecutive overlapping 3-month seasons.
CPC considers El Niño or La Niña conditions to occur when the monthly Niño3.4 OISST departures meet or exceed +/- 0.5ºC along with consistent atmospheric features. These anomalies must also be forecast to persist for 3 consecutive months.
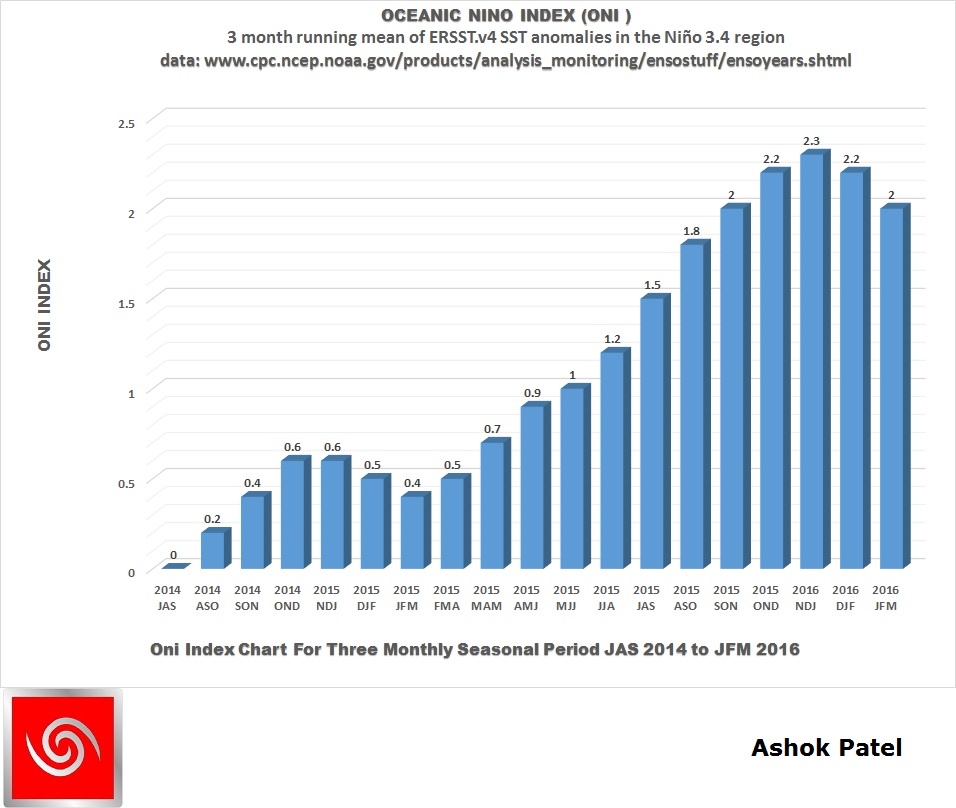
Due to the adoption of SST departures from average in the Niño 3.4 region which is now based on a set of improved homogeneous historical SST analyses (Extended Reconstructed SST – ERSST.v4), the El Nino declared at the end of March 2015 went bust. Subsequently the current El Nino event was confirmed at the end of August 2015. The graph below shows that currently, a strong El Nino persists till March 2016, the last available 3 monthly season being JFM 2016. It also shows that the full fledged El Nino declared JFM 2015 went bust because the ONI index for JFM 2015 was marked down to +0.4 C which is below the El Nino thresh hold.
Latest Oceanic Nino Index (ONI) Graph till March 2015
NINO 3.4 Region

YR   MON  TOTAL ClimAdjust ANOM

2015   1   27.22   26.71    0.51
2015   2   27.25   26.89    0.36
2015   3   27.79   27.37    0.42
2015   4   28.59   27.85    0.73
2015   5   28.83   27.96    0.87
2015   6   28.70   27.73    0.97
2015   7   28.50   27.31    1.20
2015   8   28.47   26.96    1.51
2015   9   28.62   26.87    1.75
2015  10   28.86   26.83    2.03
2015  11   29.14   26.78    2.36
2015  12   29.04   26.73    2.31
2016   1   28.94   26.71    2.23
2016   2   28.89   26.89    2.00
2016   3   29.00   27.37    1.63
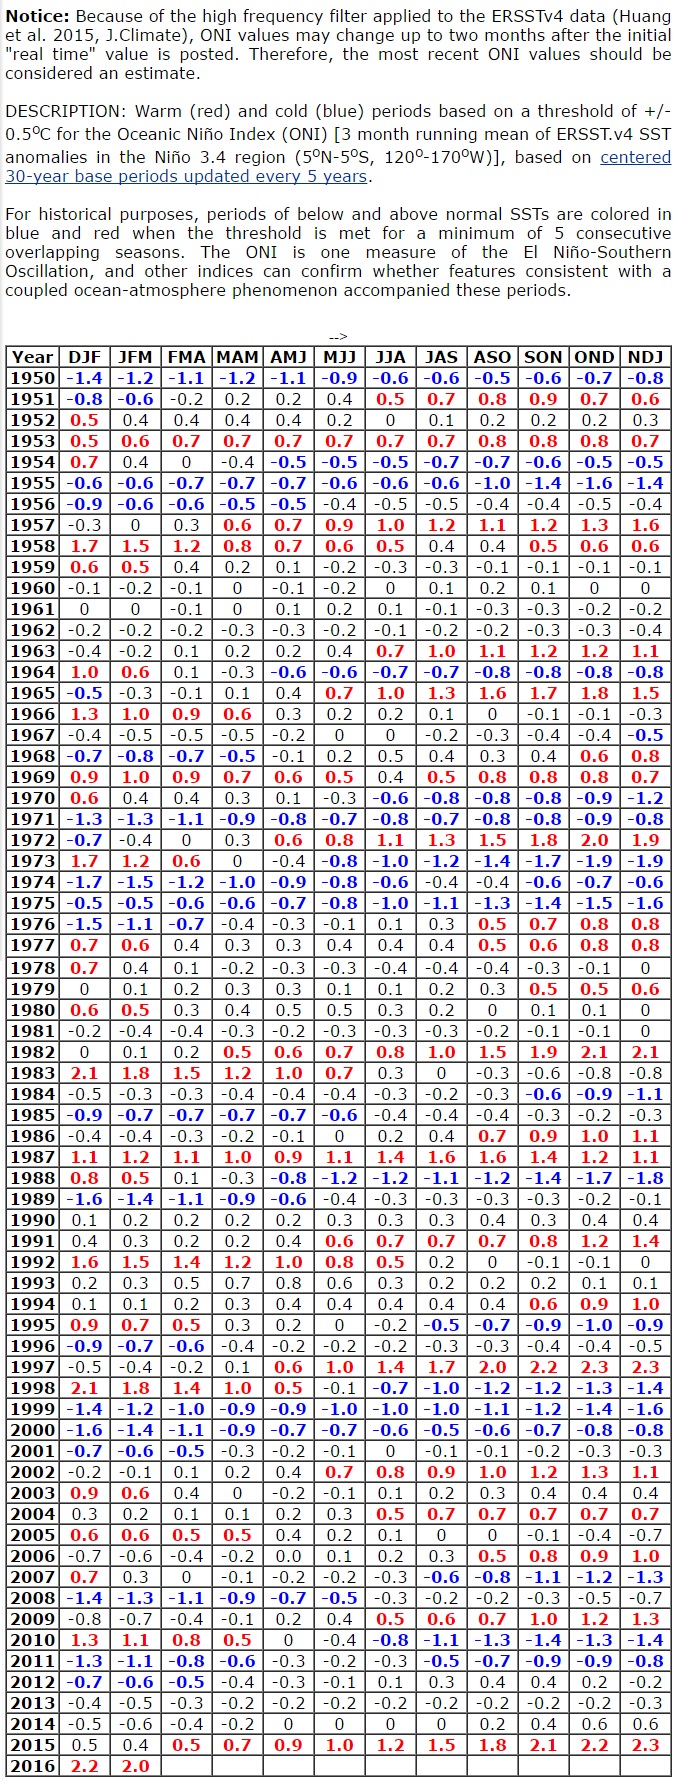
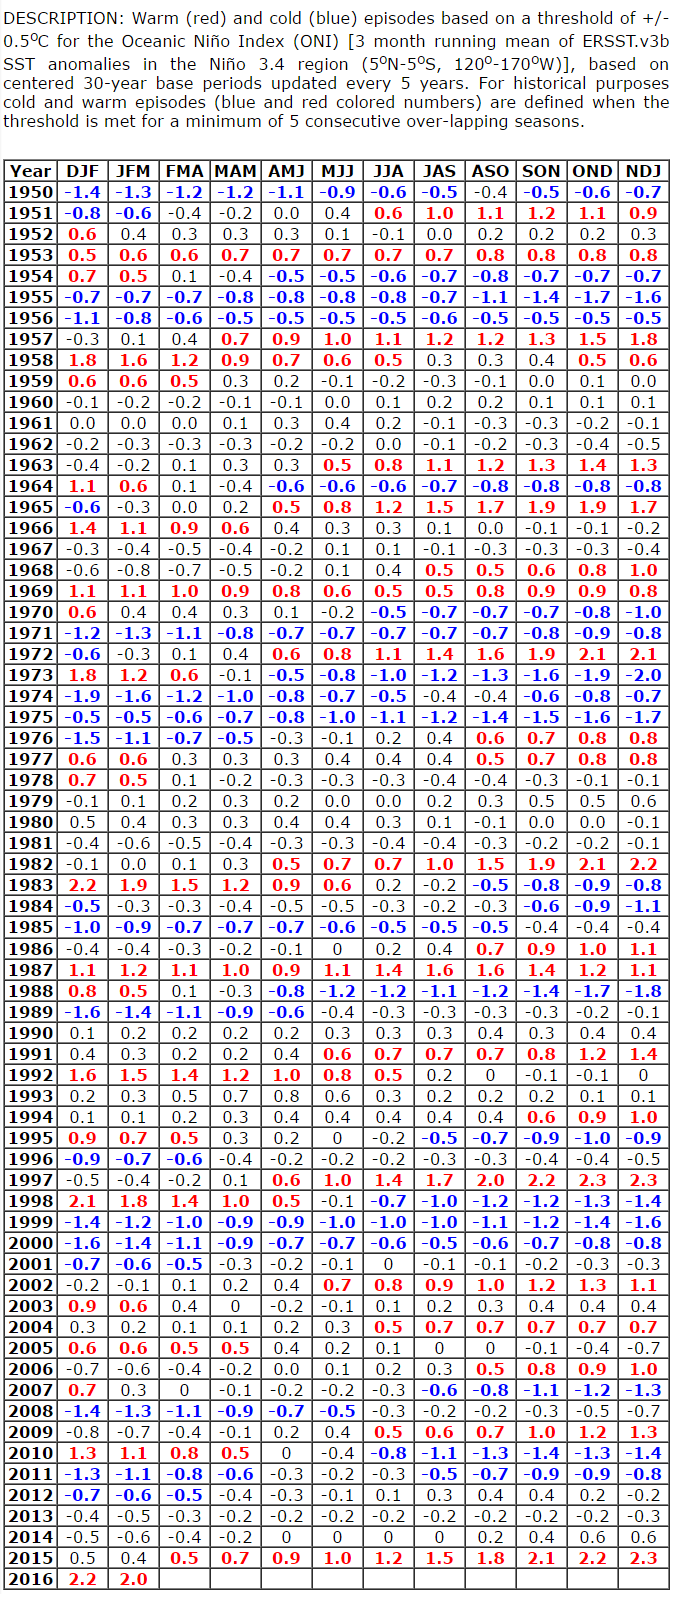
Many past El Nino events have been downgraded or cancelled and some new La Nina events have been declared retrospectively and in the same way some La Nina events have been upgraded to ENSO neutral conditions and ENSO neutral conditions have been classified as El Nino events due to the introduction of Extended Reconstructed SST – ERSST.v4. The details of past ENSO events can be compared as per current ERSST.v4 and earlier ERSST.v3b available here ERSST.v4 and here ERSST.v3b. Image file has been created from screenshots of the ONI tables from respective links for convenience.
Current version of ONI ERSST.v4
Earlier version of ONI ERSST.v3b
The Climatology used for SST is 1981-2010. However, as per DESCRIPTION: Warm (red) and cold (blue) periods based on a threshold of +/- 0.5oC for the Oceanic Niño Index (ONI) [3 month running mean of ERSST.v4 SST anomalies in the Niño 3.4 region (5oN-5oS, 120o-170oW)], based on (click the link for details) centered 30-year base periods updated every 5 years .
The update of Climatology should have been done in the beginning of 2016 to 30 year base period of 1986-2015. As and when the Climatology base year is updated, there will be some changes to ONI values of the most recent decades and may affect classification of ENSO events of the most recent decades.
ENSO Outlook
An alert system for the El Niño–Southern Oscillation
Issued by BOM -Australian Government on 12th April 2016
Increased chance of La Niña by spring 2016 (Southern Hemisphere)
Southern Oscillation Index
The Southern Oscillation Index (SOI) is in the negative territory from June end 2015 till date mostly in negative zone (-7.0 or less) with a brief neutral zone in November 2015 ( -5.3) and March 2016 (-4.7). The latest 30-day SOI value from BOM-Australian Government for period ending 18 April is −16.4.
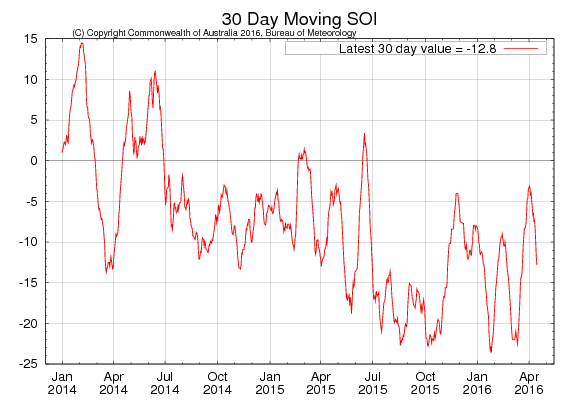
SOI Monthly graph till end of March 2016 – The Long Paddock – Queensland Government. The Latest 30 days SOI was -14.66 on 19th April 2016
Normal monsoon set from 2016