The First La Niña Threshold Achieved at the End of January 2025 – It’s a Long Way to Go!
Enso Status on 5th February 2025
Analysis & Commentary by Ashok Patel
Several international meteorological agencies—including the Indian Meteorological Department and various private organizations—had anticipated the development of a La Niña event during the Indian Summer Monsoon of 2024. However, by the end of 2024, the necessary La Niña threshold had not been met. In contrast, I presented a counter perspective through monthly blog posts from July to January 2025.
What is a Fully Developed La Niña?
To understand why the anticipated La Niña did not materialize, it’s important to define what constitutes a “fully developed La Niña,” or a “full-fledged La Niña,” based on NOAA’s operational definitions for ENSO (El Niño-Southern Oscillation):
- El Niño is characterized by a positive Oceanic Niño Index (ONI) greater than or equal to +0.5ºC.
- La Niña is defined by a negative ONI less than or equal to -0.5ºC.
For an event to be classified as a full-fledged El Niño or La Niña, the respective ONI threshold must be met or exceeded for at least five consecutive overlapping 3-monthly seasons.
ONI Data has been obtained from CPC – NWS – NOAA available here
The Niño3.4 SST has been recorded at -0.25°C for November 2024, -0.60°C for December 2024 and -0.76°C for January 2025. This gives the Oceanic Niño Index (ONI) of -0.5°C for (November-December-January) 2024-25 season, thereby attaining the First La Nina threshold at the end of January 2025.
This development has potentially set the stage for a fully developed La Niña by May 2025, provided the La Niña thresholds are sustained across all overlapping consecutive three-monthly seasons until then. Hence, its a long way to go!
It is possible that the La Niña threshold may only be exceeded for a total period of four or fewer consecutive overlapping three-month seasons, which then for historical purpose would be considered ENSO-neutral. There is also a possibility of reclassification of ENSO status due to the nuances of updated SST of the Nino regions with base period (1996–2025). CPC creates an additional 30-year base period every 5 years (the next update will be at the beginning of 2026).
How ONI is determined:
The ONI is based on SST departures from average in the Niño 3.4 region, and is a principal measure for monitoring, assessing, and predicting ENSO. Defined as the three-month running-mean SST departures in the Niño 3.4 region. Departures are based on a set of improved homogeneous historical SST analyses (Extended Reconstructed SST – ERSST.v5).
In real-time operations, the past 30-year base period (e.g. 1991–2020) will continue to be used to compute the departure from average. However, CPC will create an additional 30-year base period every 5 years (the next update will be at the beginning of 2026). When these 5 year updates occur, the ONI values over the most recent decade will change slightly because of the inclusion of more recent data. Every five years, this method takes care of climatological changes in the SST of Nino3.4 region and the buzz about the need to adopt Relative Nino Index is not justified.
NOAA Operational Definitions for El Niño and La Niña, El Niño: characterized by a positive ONI greater than or equal to +0.5ºC. La Niña: characterized by a negative ONI less than or equal to -0.5ºC. By historical standards, to be classified as a full-fledged El Niño or La Niña episode, these thresholds must be exceeded for a period of at least 5 consecutive overlapping 3-month seasons.
CPC considers El Niño or La Niña conditions to occur when the monthly Niño3.4 OISST departures meet or exceed +/- 0.5ºC along with consistent atmospheric features. These anomalies must also be forecast to persist for 3 consecutive months.
The Climate Prediction Center (CPC) is a United States Federal Agency that is one of the NECP, which are a part of the NOAA
Latest Oceanic Nino Index Graph Shows Enso Neutral
Conditions Prevail At The End Of January 2025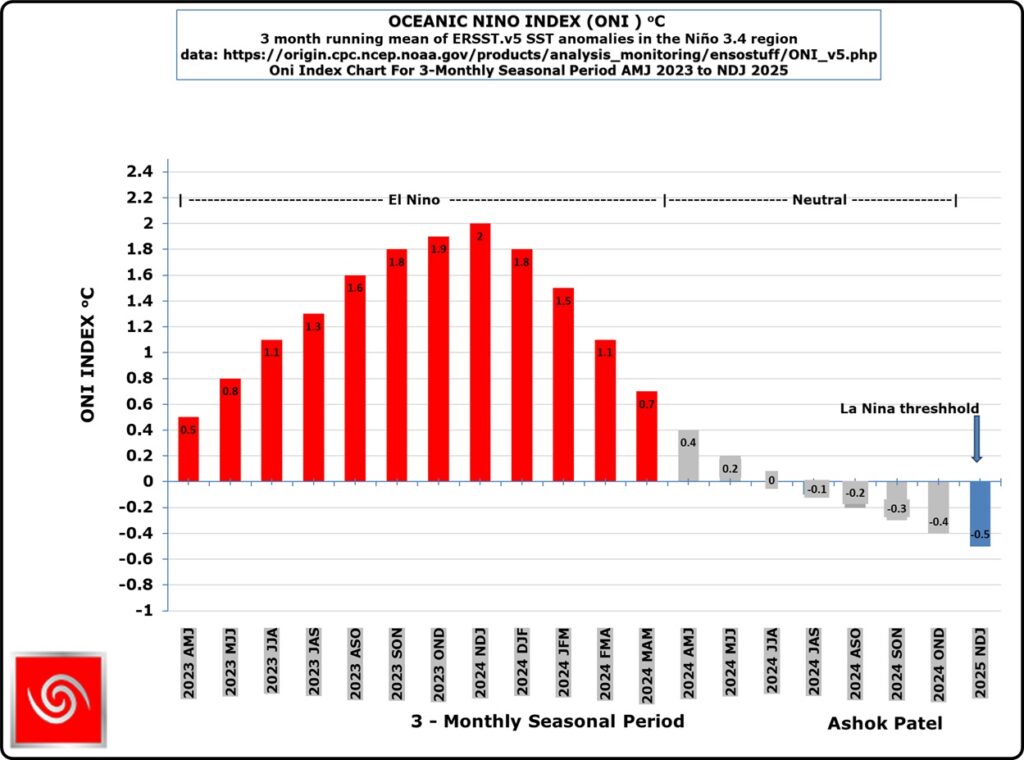
The Table below shows the monthly SST of Nino3.4 Region and the Climate adjusted normal SST and SST anomaly from February 2023. Climate Base 1991-2020. ERSST.v5
Period    Nino3.4 ClimAdjust
YR   MON  Temp.ºC Temp.ºC ANOM ºC


2023   2   26.30   26.76   -0.46
2023   3   27.19   27.29   -0.11
2023   4   27.96   27.83    0.14
2023   5   28.40   27.94    0.46
2023   6   28.57   27.73    0.84
2023   7   28.31   27.29    1.02
2023   8   28.21   26.86    1.35
2023   9   28.32   26.72    1.60
2023  10   28.44   26.72    1.72
2023  11   28.72   26.70    2.02
2023  12   28.63   26.60    2.02
2024   1   28.37   26.55    1.82
2024   2   28.28   26.76    1.52
2024   3   28.42   27.29    1.12
2024   4   28.60   27.83    0.78
2024   5   28.17   27.94    0.24
2024   6   27.91   27.73    0.18
2024   6   27.90   27.73    0.17
2024   7   27.34   27.29    0.05
2024   8   26.74   26.86   -0.12
2024   9   26.46   26.72   -0.26
2024  10   26.45   26.72   -0.27
2024  11   26.46   26.70   -0.25
2024  12   26.00   26.60   -0.60
2025   1   25.79   26.55   -0.76
Indications and analysis of various International Weather/Climate agencies monitoring Enso conditions is depicted hereunder:
Summary by: Climate Prediction Center / NCEP Dated 3rd February 2025
ENSO Alert System Status: La Niña Advisory
La Niña conditions are present.*
Equatorial sea surface temperatures (SSTs) are below average in the central and east-central Pacific Ocean.
La Niña conditions are expected to persist through February-April 2025 (59% chance), with a transition to ENSO-neutral likely during March-May 2025 (60% chance).
Note: Statements are updated once a month (2nd Thursday of each month) in association with the ENSO Diagnostics Discussion, which can be found by clicking here.
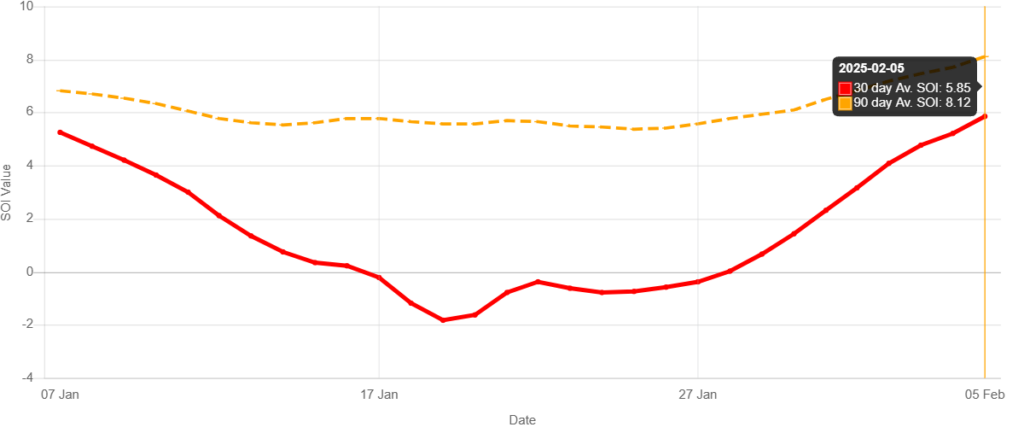
Recent (preliminary) Southern Oscillation Index values as per The Long Paddock – Queensland Government.
The 30 Days average SOI for end of January 2025 was in the neutral zone at 2.19, however, on 5th February 2025 it has increased and is still in neutral zone at +5.85 as per The Long Paddock – Queensland Government. The 90 Days average SOI has also increased to +8.12 on 5th February 2025.
As per BOM – Australia 5th February 2025
- Sea surface temperatures (SSTs) in the Australian region during January 2025 were the warmest on record for all Januarys since records began in 1900, Additionally, the SST anomaly was also the equal most positive value on record for any month. The latest weekly SST analysis shows warmer waters around most of the Australian coastline, but particularly across the western Australian coastline, providing increased atmospheric moisture and energy that may influence the severity of weather systems.
- The El Niño–Southern Oscillation (ENSO) has remained neutral for the past 6 months, despite changes in sea surface temperature patterns consistent with a developing La Niña.
- Since late December, the tropical Pacific has become more La Niña-like, with both oceanic and atmospheric indices beginning to align. However, this response has not consistently met the Bureau’s La Niña thresholds.
- The weekly Niño34 index has fluctuated around the La Niña threshold of −0.8 °C since late 2024, with the most recent value of −0.86 °C (for the week ending 26 January) dropping just below the La Niña threshold.
- All international models surveyed forecast neutral ENSO (neither El Niño nor La Niña) from March until at least June.
- Historically, it is very late in the typical ENSO cycle for a La Niña event to develop, with La Niña also tending to have a weaker association with Australian temperature and rainfall patterns during summer compared to winter and spring.
- Note: The seasons stated in BOM communications refer to Southern Hemisphere.