ENSO Status on 7th March 2018
The ONI is based on SST departures from average in the Niño 3.4 region, and is a principal measure for monitoring, assessing, and predicting ENSO. Defined as the three-month running-mean SST departures in the Niño 3.4 region. Departures were based on a set of improved homogeneous historical SST analyses (Extended Reconstructed SST – ERSST.v4) and have now been updated to further improved homogeneous historical SST analyses (Extended Reconstructed SST – ERSST.v5). Explanation about ERSST.v5 is given here.
The SST reconstruction methodology is described in Huang et al., 2015, J. Climate, vol. 28, 911-930.
CPC uses current Climatology based on 1986-2015 which has been changed late last year from base years 1981-2010. Explanation about Climatology base years change is given here.
NOAA Operational Definitions for El Niño and La Niña, El Niño: characterized by a positive ONI greater than or equal to +0.5ºC. La Niña: characterized by a negative ONI less than or equal to -0.5ºC. By historical standards, to be classified as a full-fledged El Niño or La Niña episode, these thresholds must be exceeded for a period of at least 5 consecutive overlapping 3-month seasons.
CPC considers El Niño or La Niña conditions to occur when the monthly Niño3.4 OISST departures meet or exceed +/- 0.5ºC along with consistent atmospheric features. These anomalies must also be forecast to persist for 3 consecutive months.
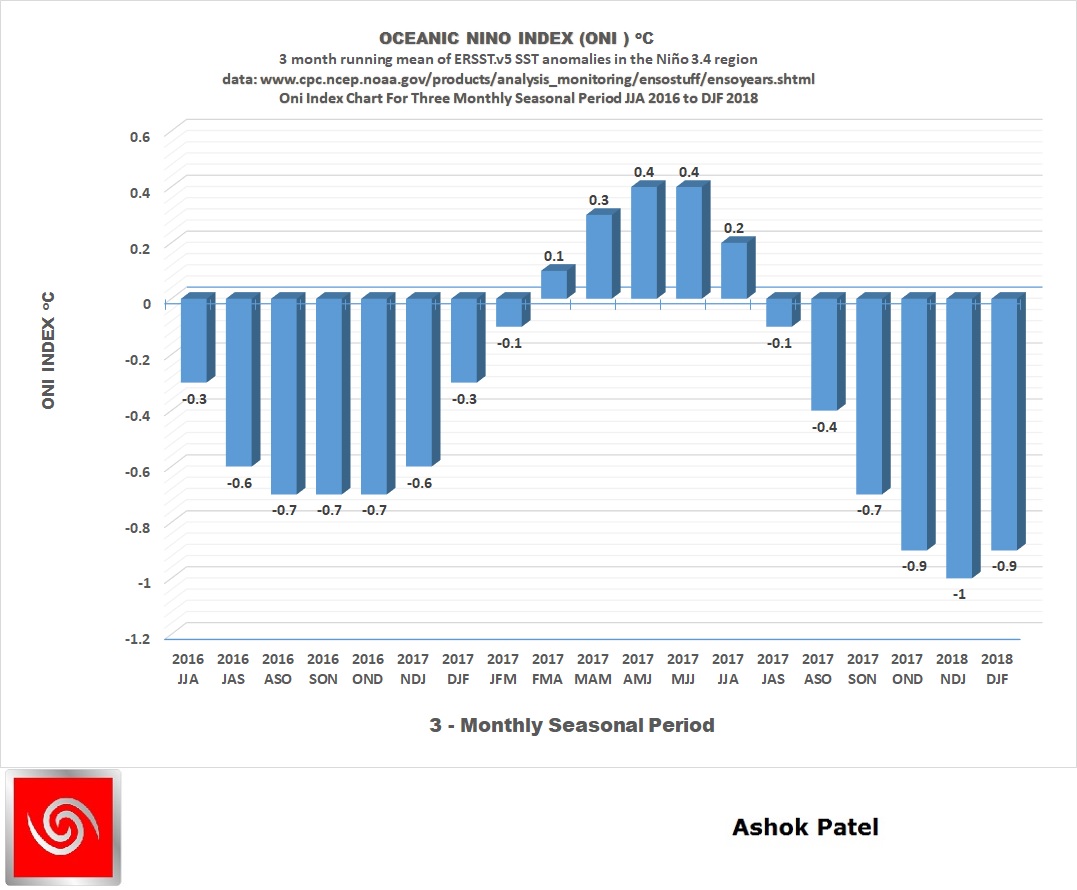
Enso neutral conditions have prevailed subsequent to the last 2016-17 La Nina event that ended at the end of January 2017 (NDJ 2017).
Last five ONI Index are ASO 2017 -0.4ºC, SON 2017 -0.7ºC, OND 2017 -0.9ºC, NDJ 2018 -1.0ºC and DJF 2018 -0.9ºC. Now four 3-monthly seasonal ONI Index are in the La Nina zone, so an official La Nina event is expected at the end of March 2018.
Latest Oceanic Nino Index (ONI) Graph Showing Enso Neutral Event Ending February 2018
(Potential La Nina At The End Of March 2018)
The Table below shows the monthly SST of Nino3.4 Region and the Climate adjusted normal SST and SST anomaly for last two years. Climate Base 1986-2015. ERSST.v5
Period    Nino3.4 ClimAdjust
YR   MON  Temp.ºC Temp.ºC ANOM ºC

2016   2   29.00   26.66    2.34
2016   3   28.90   27.21    1.70
2016   4   28.73   27.73    0.99
2016   5   28.24   27.85    0.39
2016   6   27.70   27.65    0.05
2016   7   26.82   27.26   -0.44
2016   8   26.28   26.91   -0.63
2016   9   26.15   26.80   -0.65
2016  10   25.98   26.75   -0.78
2016  11   25.95   26.75   -0.80
2016  12   26.10   26.65   -0.55
2017   1   26.12   26.45   -0.33
2017   2   26.68   26.66    0.02
2017   3   27.33   27.21    0.12
2017   4   28.04   27.73    0.30
2017   5   28.30   27.85    0.45
2017   6   28.06   27.65    0.41
2017   7   27.54   27.26    0.28
2017   8   26.70   26.91   -0.21
2017   9   26.29   26.80   -0.51
2017  10   26.15   26.75   -0.60
2017  11   25.74   26.75   -1.01
2017  12   25.62   26.65   -1.04
2018   1   25.58   26.45   -0.87
2018   2   25.96   26.66   -0.70
CPC considers El Niño or La Niña conditions to occur when the monthly Niño3.4 OISST departures meet or exceed +/- 0.5°C along with consistent atmospheric features. These anomalies must also be forecast to persist for 3 consecutive months.
Southern Oscillation Index
As per BOM, Australia:
The 30-day Southern Oscillation Index (SOI) to 5th March 2018 is −2.3, which is within the neutral range. While the SOI fluctuates more during the southern hemisphere summer due to movement of tropical systems, it has spent most of 2018 to date within the neutral range.
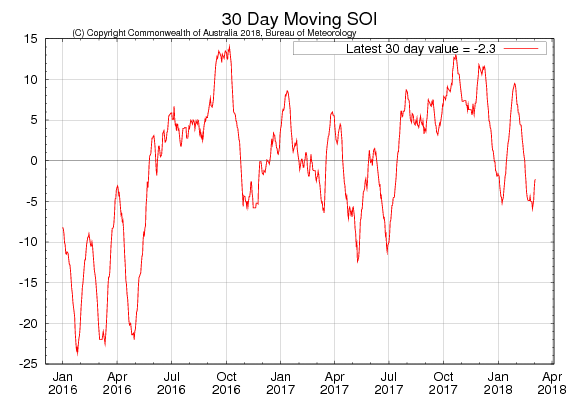
Sustained positive values of the SOI above +7 typically indicate La Niña while sustained negative values below −7 typically indicate El Niño. Values between about +7 and −7 generally indicate neutral conditions.
Recent (preliminary) Southern Oscillation Index values as per The Long Paddock – Queensland Government.
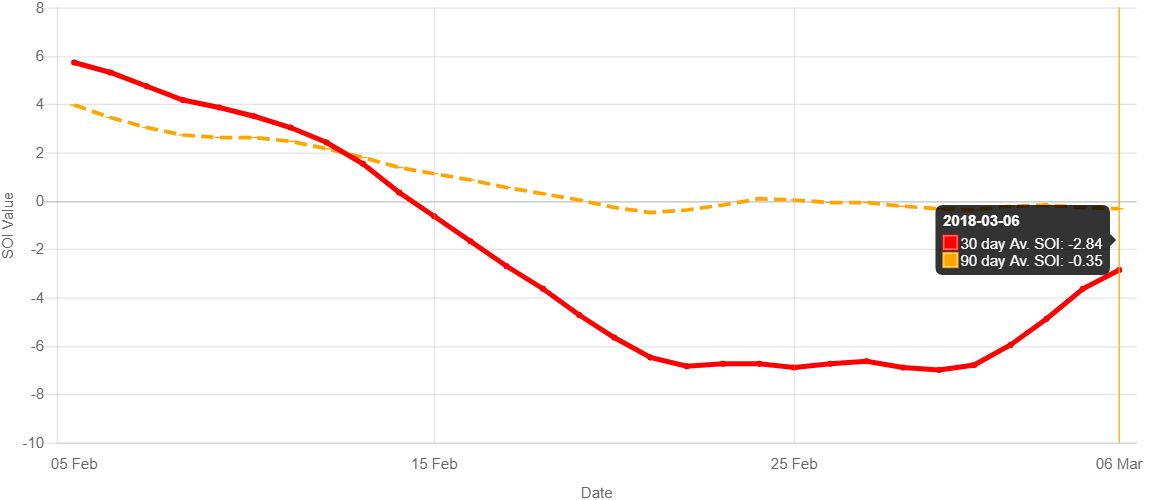
SOI Monthly graph up to February 2018 as per The Long Paddock – Queensland Government.
30 Days average SOI was -6.91 at the end of February 2018 and -2.84 on 6th March 2018 as per The Long Paddock – Queensland Government and 90 Days average SOI was -0.35.
Summary by: Climate Prediction Center / NCEP Dated 5th March 2018
ENSO Alert System Status: La Niña Advisory
La Niña conditions are present.*
Equatorial sea surface temperatures (SSTs) are below average across the central and eastern Pacific Ocean. A transition from La Niña to ENSO-neutral is most likely during the Northern Hemisphere spring (~55% chance of ENSO-neutral during the March-May season).*
As per BOM -Australia 27th February 2018
ENSO outlooks
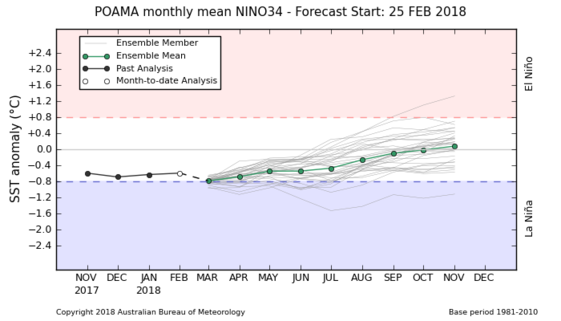
All international climate models surveyed by the Bureau indicate that the current event is likely near its end.
Four of the eight surveyed models maintain values close to La Niña thresholds for March, but all models indicate equatorial Pacific sea surface temperatures are likely to continue to warm over the coming months. Only one model anticipates NINO3.4 will meet La Niña thresholds for May, and all models predict ENSO will be in a neutral phase during the southern hemisphere winter.
In order to consider 2017–18 a La Niña year, NINO3 or NINO3.4 values cooler than −0.8 °C need to be observed for at least three months.
Ashok Patel’s Final Note:
Using NOAA Criteria A Full Fledged La Nina is expected to be declared at the End Of March 2018.
The current SST February 2018 of Nino 3.4 region is at -0.87°C and so now last four ONI Index have La Nina thresh hold as SON 2017 at -0.7°C, OND 2017 at -0.9°C, NDJ 2018 at -1.0°C and DJF 2018 at -0.9°C and so Enso Neutral conditions prevails. Potential La Nina event is expected to commence at the end of March 2018 since the next 3-monthly season namely JFM 2018 is very likely to remain equal to or below -0.5°C. Thereby a 2017-18 La Nina event is expected to commence at the end of 2018 March as per NOAA criteria.
It is surprising that BOM Australlia on 27th February says “La Niña retreats.”
Similarly also surprising to see that NOAA CPC/NCEP update of 5th March says “A transition from La Niña to ENSO-neutral is most likely during the Northern Hemisphere spring (~55% chance of ENSO-neutral during the March-May season)”. NOAA’s contention is indeed strange.
How can there be a transition from La Nina to ENSO-neutral when the La Nina event has not yet been declared officially? At least end of March 2018 is not expected to be in ENSO neutral zone.
અશોક પટેલ ની નોંધ :
NOAA માપદંડ મુજબ વિધિવત La Nina 2018 માર્ચ આખર સુધી મા શક્ય.
છેલ્લા 4 ત્રી-માસિક સીઝન માં ONI ઈન્ડેક્સ -0.5°C અથવા તેનાથી નીચે રહેલ છે, જેમ કે SON 2017 at -0.7°C, OND 2017 at -0.9°C, NDJ 2018 at -1.0°C and DJF 2018 at -0.9°C. તેમજ પાંચમું ONI ઈન્ડેક્સ -0.5°C અથવા તેનાથી નીચે રહેવાની પુરે પુરી શક્યતા છે. એટલે NOAA માપદંડ મુજબ વિધિવત La Nina 2018 માર્ચ આખરે ડિક્લેર થવાની પુરી શક્યતા છે.
ઓસ્ટ્રેલિયા ની BOM સંસ્થા ના 27 ફેબ્રુઆરી ના બુલેટિન મુજબ La Nina પીછે હાટ કરે છે. જયારે NOAA તારીખ 5 માર્ચ 2018 બુલેટિન મુજબ La Nina માંથી ENSO ન્યુટ્રલ પરિસ્થિતિ માર્ચ થી મે 2018 સુધી માં થશે. આ બંને એજંસીઓ ના છેલ્લા બુલેટિન માં વિચિત્રતા છે. હજુ La Nina થયું નથી અને NOAA કહે છે કે “La Nina માંથી ENSO ન્યુટ્રલ પરિસ્થિતિ માર્ચ થી મે 2018 સુધી માં થશે.”
મારુ માનવું છે કે માર્ચ 2018 સુધી માં La Nina થશે અને ENSO ન્યુટ્રલ પરિસ્થિતિ શક્યતા નથી.
All earlier updates are listed below:
Click here for Update “Three Consecutive 3-Monthly Seasons Have Oni -0.5ºC Or Below”
Click here for Update “ENSO Neutral Conditions Prevails”
Click here for Update “ENSO Neutral Conditions Prevails With JAS 2017 ONI Index At -0.2ºC”
Click here for Update “Theoretically El Nino Not Possible During 2017”
Click here for Update “Theoretically El Nino Not Possible During The Indian Southwest Monsoon 2017”