Saurashtra & Kutch Rainfall Period 1901-2017
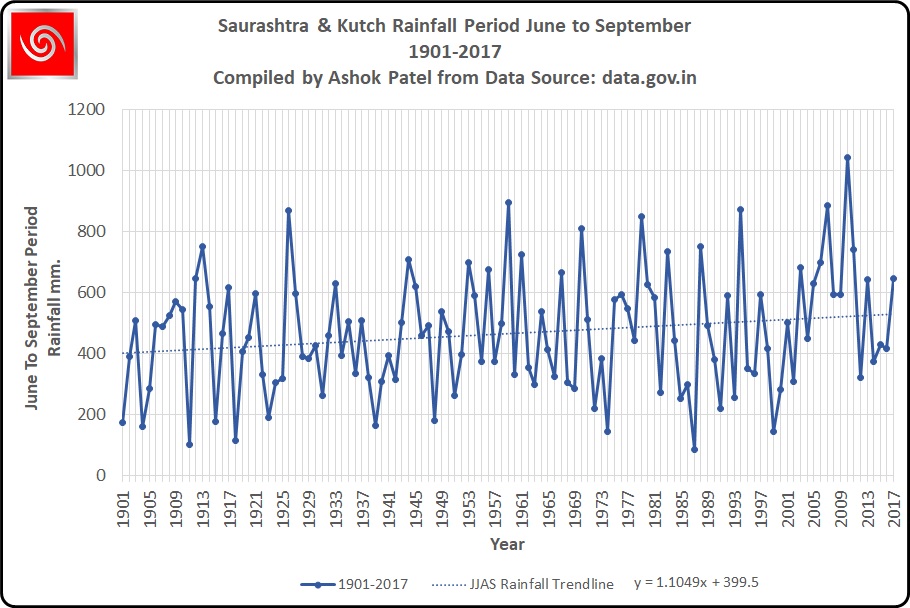
Climate of any Region is a 30 years average of weather parameters of that Region. Saurashtra & Kutch Region is Western part of Gujarat State in India. Rainfall Data for Saurashtra & Kutch has been obtained from https://data.gov.in/ for the period 1901 to 2017. Saurashtra & Kutch region receives its main rainfall during the Southwest Monsoon period from June to September. Rainfall graph has been plotted and a trend line is also plotted for the period 1901-2017, which depicts that the Rainfall has increased during this period as shown by the trend line.
Saurashtra & Kutch Rainfall Period 1901-1960
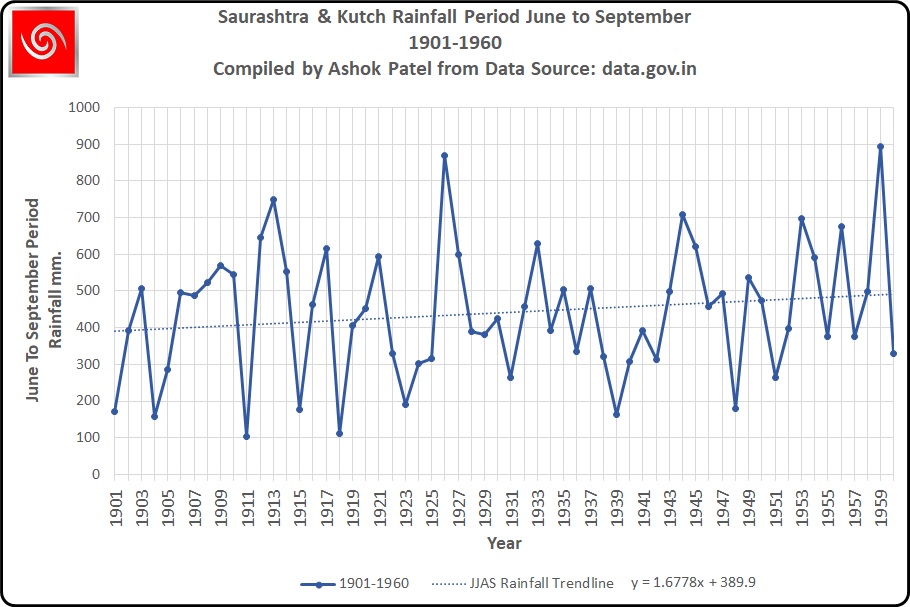
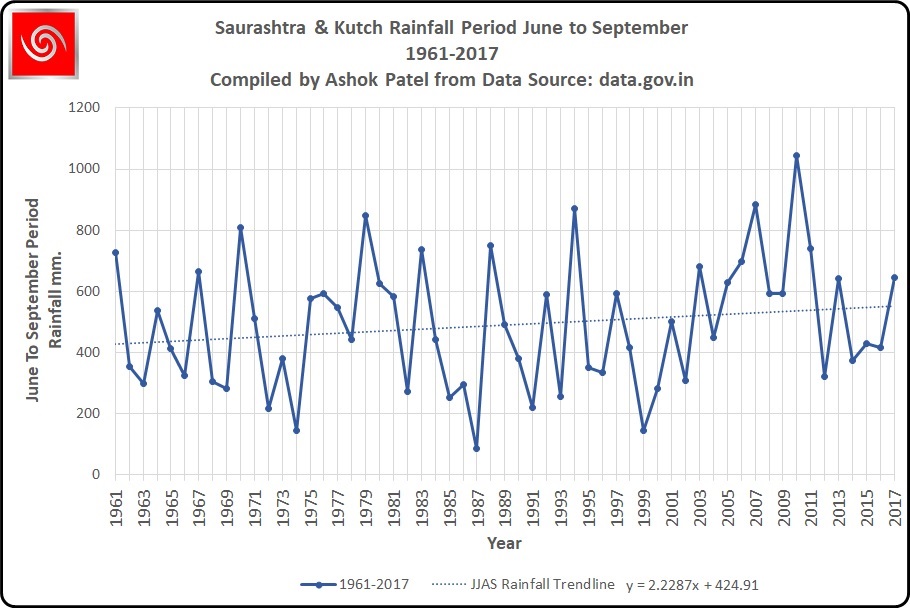
Here below are some more graphs to show that the Rainfall trend line has been positive even on a smaller period of 60 years. The 117 years period has been divided into two parts 1901-1960 and another from 1961-2017. Both these graphs show that Rainfall over Saurashtra & Kutch Region shows positive trend.
Saurashtra & Kutch Rainfall Period 1961-2017
Saurashtra & Kutch Rainfall Period 1931-1990
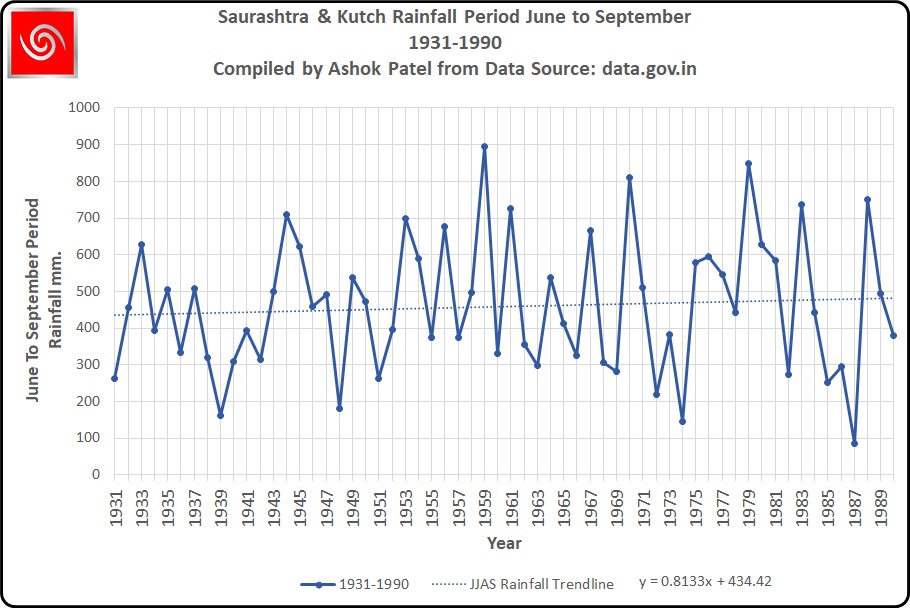
One more graph for an intermediate 60 years period from 1931-1990 has also been plotted. This graph too shows a positive trend in Rainfall over Saurashtra & Kutch.
Climatology Average Rainfall Saurashtra & Kutch
The Climatology Rainfall for a particular year is the Average Rainfall during the last 30 years. The Climatology average Rainfall for Saurashtra & Kutch Region for various periods also shows that the Climatology average Rainfall has increased over the four progressive periods shown here under:
| Sr. No. | Climatology Period Years | Average Rainfall mm. |
|---|---|---|
| 1 | 1901-1930 | 427.1 |
| 2 | 1931-1960 | 455.1 |
| 3 | 1961-1990 | 463.4 |
| 4 | 1988-2017 | 520.9 |
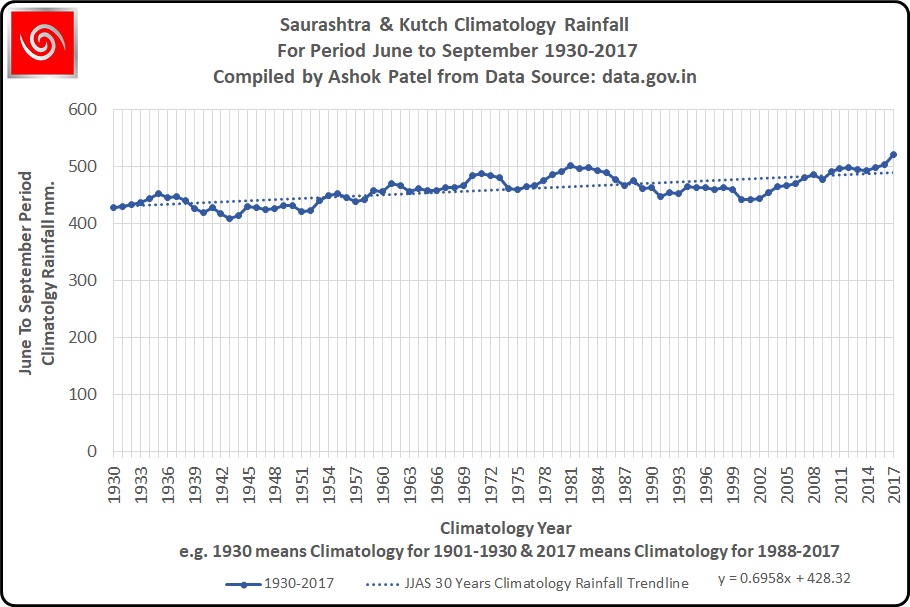
Yearly Climatology Rainfall Saurashtra & Kutch Period 1930-2017
The graph below shows the Climatology Rainfall for period 1930-2017. The Climatology for 1930 means the 30 years average Rainfall from 1901-1930. Similarly the Climatology for the year 2000 would mean the 30 years average Rainfall from 1971-2000 and the Climatology for 2017 would mean the average Rainfall for 30 years from 1988-2017.
The graph clearly indicates that the overall trend of Climatology Rainfall over Saurashtra & Kutch has been positive or increasing as shown by the trend line. The Climatology Rainfall from 2011 has been above the Trend line as can be seen from the graph here under:
Bahuj saras mahiti aapi
Thanks sir
Kerlama kyare somasanu agaman thase sir
Gai kaal na comment vanchya hoy toe aa prashna tamo na karvi padat. Darek Comment and tena jawab vancho.
Namaste sir
સર નમસ્તે આપડે કયાર થી શરુ થશે ચોમાસું
Hu LGAKN (Hu Lambaa Gaadani Aagahi Karto Nathi)
Preemonsoon kyare ectiv thase
Kerala ma chomasu bese pachhi
Good work ASHOK Bhai sir