Enso Status on 6th July 2018
Enso Neutral Conditions Prevails June 2018
The ONI is based on SST departures from average in the Niño 3.4 region, and is a principal measure for monitoring, assessing, and predicting ENSO. Defined as the three-month running-mean SST departures in the Niño 3.4 region. Departures are based on a set of further improved homogeneous historical SST analyses (Extended Reconstructed SST – ERSST.v5). Explanation about ERSST.v5 is given here.
The SST reconstruction methodology is described in Huang et al., 2015, J. Climate, vol. 28, 911-930.
CPC uses current Climatology based on 1986-2015 which has been changed late last year from base years 1981-2010. Explanation about Climatology base years change is given here.
NOAA Operational Definitions for El Niño and La Niña, El Niño: characterized by a positive ONI greater than or equal to +0.5ºC. La Niña: characterized by a negative ONI less than or equal to -0.5ºC. By historical standards, to be classified as a full-fledged El Niño or La Niña episode, these thresholds must be exceeded for a period of at least 5 consecutive overlapping 3-month seasons.
CPC considers El Niño or La Niña conditions to occur when the monthly Niño3.4 OISST departures meet or exceed +/- 0.5ºC along with consistent atmospheric features. These anomalies must also be forecast to persist for 3 consecutive months.
Last five ONI Index are DJF 2018 -0.9ºC, JFM 2018 -0.8ºC, FMA 2018 -0.6ºC, MAM 2018 -0.4ºC and AMJ 2018 -0.1ºC. Latest Nino 3.4 SST is 0.11ºC and the calculated ONI AMJ 2018 -0.1ºC is negative but in neutral zone. Hence ENSO neutral conditions continues to exist.
La Nina event 2017-18 had officially evolved at the end of March 2018 (JFM 2018). ENSO neutral conditions exists since then. The last La Nina event was the second consecutive La Nina event, the first one was 2016-17 La Nina event that ended at the end of January 2017 (NDJ 2017).
Latest Oceanic Nino Index Graph Shows ENSO Neutral Conditions Continues AMJ 2018 Season

The Table below shows the monthly SST of Nino3.4 Region and the Climate adjusted normal SST and SST anomaly for last two years. Climate Base 1986-2015. ERSST.v5
Period    Nino3.4 ClimAdjust
YR   MON  Temp.ºC Temp.ºC ANOM ºC

2016   6   27.70   27.65    0.05
2016   7   26.82   27.26   -0.44
2016   8   26.28   26.91   -0.63
2016   9   26.15   26.80   -0.65
2016  10   25.98   26.75   -0.78
2016  11   25.95   26.75   -0.80
2016  12   26.10   26.65   -0.55
2017   1   26.12   26.45   -0.33
2017   2   26.68   26.66    0.02
2017   3   27.33   27.21    0.12
2017   4   28.04   27.73    0.30
2017   5   28.30   27.85    0.45
2017   6   28.06   27.65    0.41
2017   7   27.54   27.26    0.28
2017   8   26.70   26.91   -0.21
2017   9   26.29   26.80   -0.51
2017  10   26.15   26.75   -0.60
2017  11   25.74   26.75   -1.01
2017  12   25.62   26.65   -1.04
2018   1   25.58   26.45   -0.88
2018   2   25.98   26.66   -0.68
2018   3   26.50   27.21   -0.71
2018   4   27.32   27.73   -0.41
2018   5   27.74   27.85   -0.11
2018   6   27.76   27.65    0.11
CPC considers El Niño or La Niña conditions to occur when the monthly Niño3.4 OISST departures meet or exceed +/- 0.5°C along with consistent atmospheric features. These anomalies must also be forecast to persist for 3 consecutive months.
Southern Oscillation Index
As per BOM, Australia:
The 30-day Southern Oscillation Index (SOI) to 1 July was −6.2, and the 90-day SOI was −0.8. The SOI has been within the neutral range since late April.
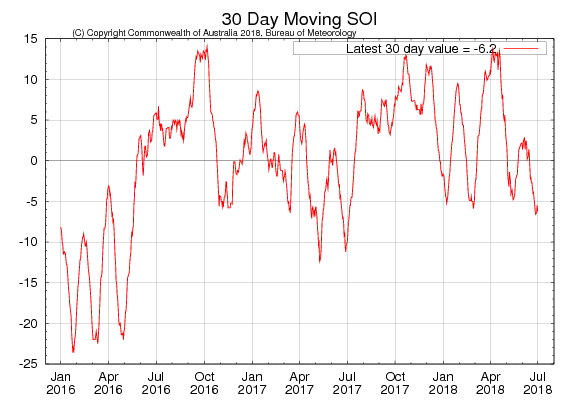
Sustained positive values of the SOI above +7 typically indicate La Niña while sustained negative values below −7 typically indicate El Niño. Values between about +7 and −7 generally indicate neutral conditions.
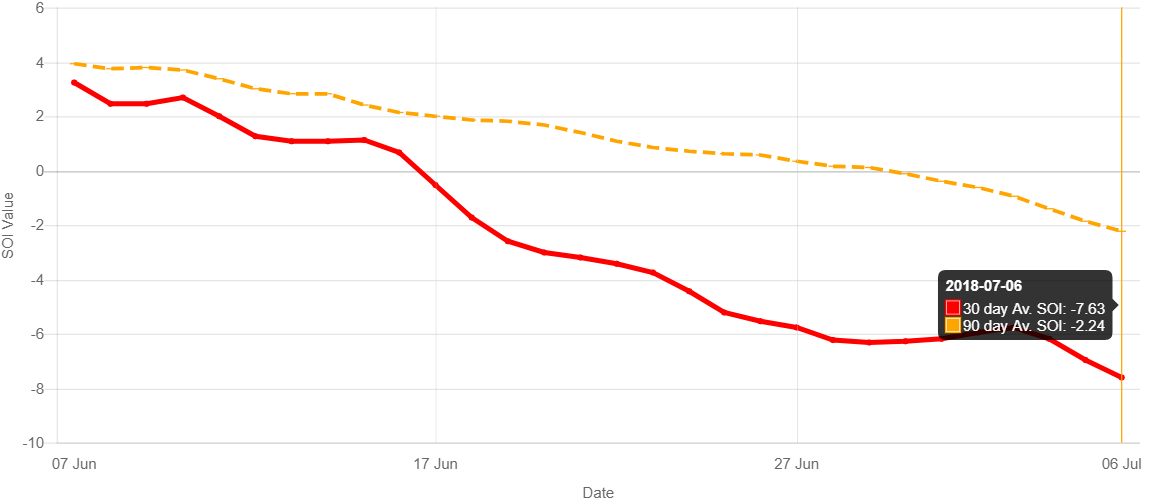
Recent (preliminary) Southern Oscillation Index values as per The Long Paddock – Queensland Government.
30 Days average SOI was -7.63 at the end of June 2018 and was -6.27 on 6th July 2018 as per The Long Paddock – Queensland Government and 90 Days average SOI was -2.24.
SOI Monthly graph up to June 2018 as per The Long Paddock – Queensland Government.
Summary by: Climate Prediction Center / NCEP Dated 2nd July 2018
ENSO Alert System Status: El Niño Watch
ENSO-neutral conditions are present.*
Equatorial sea surface temperatures (SSTs) are near-to-above average across he east-central Pacific Ocean.
ENSO-neutral is favored through Northern Hemisphere summer 2018, with the chance for El Niño increasing to 50% during fall, and ~65% during winter 2018-19.
* Note: These statements are updated once a month (2nd Thursday of each month) in association
with the ENSO Diagnostics Discussion, which can be found by clicking here.
As per BOM -Australia 3rd July 2018
ENSO outlooks
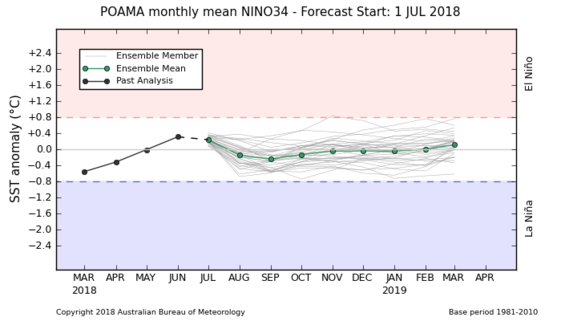
All but one of the eight surveyed international climate models predict further warming of central equatorial Pacific sea surface temperatures (SSTs) over the coming months.
During the remainder of the southern hemisphere winter, all models forecast central Pacific SSTs to remain within neutral values. However, five of the eight models reach El Niño levels during spring, with a sixth model falling just short of the threshold value.
(Note: winter/spring is with reference to Southern Hemisphere)
Ashok Patel’s Final Note:
Using NOAA Criteria, Enso Neutral conditions continue to prevail from May 2018 (MAM 2018) with the latest 3-monthly season AMJ 2018 at -0.1ºC
La Nina event 2017-18 had officially evolved at the end of March 2018 (JFM 2018) as per NOAA criteria, but did not last long.
Last five ONI Index are DJF 2018 -0.9ºC, JFM 2018 -0.8ºC and FMA 2018 -0.6ºC, MAM 2018 -0.4ºC, AMJ 2018 -0.1ºC. The last two 3-monthly seasonal ONI Index indicates Enso Neutral conditions continue to prevail from May 2018. June 2018 SST anomaly for Nino 3.4 for is 0.11ºC.
Hence, currently neither Nino 3.4 SST anomaly nor the last ONI index has even reached the El Nino thresh hold for single month or a single 3-monthly seasons respectively.
Using NOAA criteria, a full-fledged El Nino event is rules out during the Indian Summer Monsoon, since there are only three 3-monthly seasons left till end of September 2018, namely MJJ 2018, JJA 2018 & JAS 2018, and Indian Summer Monsoon normally comes to an end by then (September end). El Nino requires El Nino thresh hold to continue for five consecutive 3-month;y seasons.
અશોક પટેલ ની નોંધ :
NOAA માપદંડ મુજબ 2018 જુન આખર ના ENSO ન્યુટ્રલ સ્થિતિ ચાલુ રહી.
છેલ્લા પાંચ ત્રી-માસિક સીઝન નું ONI ઈન્ડેક્સ આ પ્રમાણે છે: DJF 2018 -0.9ºC, JFM 2018 -0.8ºC and FMA 2018 -0.6ºC, MAM 2018 -0.4ºC, AMJ 2018 -0.1ºC. છેલ્લું ત્રી-માસિક સીઝન AMJ 2018 નું ONI ઈન્ડેક્સ -0.1°C, એટલે NOAA માપદંડ મુજબ મે 2018 ની જેમ Enso ન્યુટ્રલ ઝોન માં છે. જુન 2018 નું નિનો 3.4 નું SST ઍનોમલી 0.11ºC છે. અત્યાર સુધી એક પણ મહિના નું નિનો 3.4 નું SST ઍનોમલી કે છેલ્લું ONI ઈન્ડેક્સ એલ નિનો ના ઉંબરા સુધી પહોંચેલ નથી. માટે ભારતીય ચોમાસા દરમિયાન NOAA ના માપદંડ મુજબ વિધિવત ‘એલ નિનો’ થવાની શક્યતા નથી. કારણ એમ છે કે ભારત નું ચોમાસુ સપ્ટેમ્બર આખરે પૂરું થતું હોય છે અને હવે સપ્ટેમ્બર આખર સુધી ફક્ત ત્રણ ત્રી-માસિક સીઝન બાકી છે, જે છે MJJ 2018, JJA 2018 & JAS 2018 અને એલ નિનો માટે ઓછા માં ઓછી પાંચ ત્રી-માસિક સીઝન જોઈએ.