ENSO Status on 4th May 2018
Weak La Nina Exists Till The End Of April 2018.
2018 એપ્રિલ આખર સુધી સામાન્ય લા નિના હજુ અસ્તિત્વ માં છે.
The ONI is based on SST departures from average in the Niño 3.4 region, and is a principal measure for monitoring, assessing, and predicting ENSO. Defined as the three-month running-mean SST departures in the Niño 3.4 region. Departures were based on a set of improved homogeneous historical SST analyses (Extended Reconstructed SST – ERSST.v4) and have now been updated to further improved homogeneous historical SST analyses (Extended Reconstructed SST – ERSST.v5). Explanation about ERSST.v5 is given here.
The SST reconstruction methodology is described in Huang et al., 2015, J. Climate, vol. 28, 911-930.
CPC uses current Climatology based on 1986-2015 which has been changed late last year from base years 1981-2010. Explanation about Climatology base years change is given here.
NOAA Operational Definitions for El Niño and La Niña, El Niño: characterized by a positive ONI greater than or equal to +0.5ºC. La Niña: characterized by a negative ONI less than or equal to -0.5ºC. By historical standards, to be classified as a full-fledged El Niño or La Niña episode, these thresholds must be exceeded for a period of at least 5 consecutive overlapping 3-month seasons.
CPC considers El Niño or La Niña conditions to occur when the monthly Niño3.4 OISST departures meet or exceed +/- 0.5ºC along with consistent atmospheric features. These anomalies must also be forecast to persist for 3 consecutive months.
Last five ONI Index are OND 2017 -0.9ºC, NDJ 2018 -1.0ºC, DJF 2018 -0.9ºC, JFM 2018 -0.8ºC and FMA 2018 -0.6ºC. La Nina event was already in existence and since the latest 3-monthly seasonal ONI Index is less than or equal to -0.5ºC it fulfills the NOAA criteria for continuance of La Nina at the end of April 2018.
La Nina event 2017-18 has officially evolved at the end of March 2018 (JFM 2018). This La Nina event is the second consecutive La Nina event, the other being 2016-17 La Nina event that ended at the end of January 2017 (NDJ 2017).
Latest Oceanic Nino Index (ONI) Graph Showing Continuance Of La Nina For FMA 2018 Season

The Table below shows the monthly SST of Nino3.4 Region and the Climate adjusted normal SST and SST anomaly for last two years. Climate Base 1986-2015. ERSST.v5
Period    Nino3.4 ClimAdjust
YR   MON  Temp.ºC Temp.ºC ANOM ºC

2016   3   28.90   27.21    1.70
2016   4   28.73   27.73    0.99
2016   5   28.24   27.85    0.39
2016   6   27.70   27.65    0.05
2016   7   26.82   27.26   -0.44
2016   8   26.28   26.91   -0.63
2016   9   26.15   26.80   -0.65
2016  10   25.98   26.75   -0.78
2016  11   25.95   26.75   -0.80
2016  12   26.10   26.65   -0.55
2017   1   26.12   26.45   -0.33
2017   2   26.68   26.66    0.02
2017   3   27.33   27.21    0.12
2017   4   28.04   27.73    0.30
2017   5   28.30   27.85    0.45
2017   6   28.06   27.65    0.41
2017   7   27.54   27.26    0.28
2017   8   26.70   26.91   -0.21
2017   9   26.29   26.80   -0.51
2017  10   26.15   26.75   -0.60
2017  11   25.74   26.75   -1.01
2017  12   25.62   26.65   -1.04
2018   1   25.58   26.45   -0.88
2018   2   25.98   26.66   -0.68
2018   3   26.50   27.21   -0.71
2018   4   27.27   27.73   -0.46
CPC considers El Niño or La Niña conditions to occur when the monthly Niño3.4 OISST departures meet or exceed +/- 0.5°C along with consistent atmospheric features. These anomalies must also be forecast to persist for 3 consecutive months.
Southern Oscillation Index
As per BOM, Australia:
The 30-day Southern Oscillation Index (SOI) to 2nd May 2018 was +2.4, while the 90-day SOI remains within the neutral range.
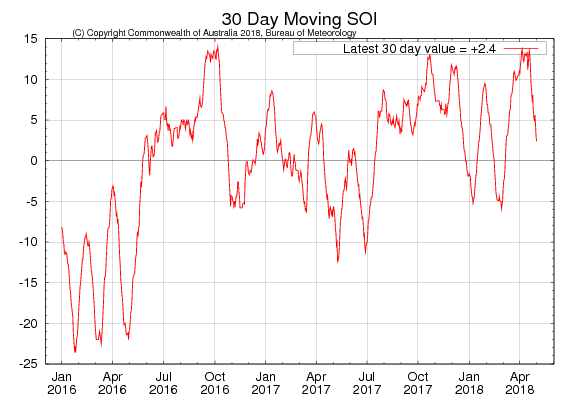
Sustained positive values of the SOI above +7 typically indicate La Niña while sustained negative values below −7 typically indicate El Niño. Values between about +7 and −7 generally indicate neutral conditions.
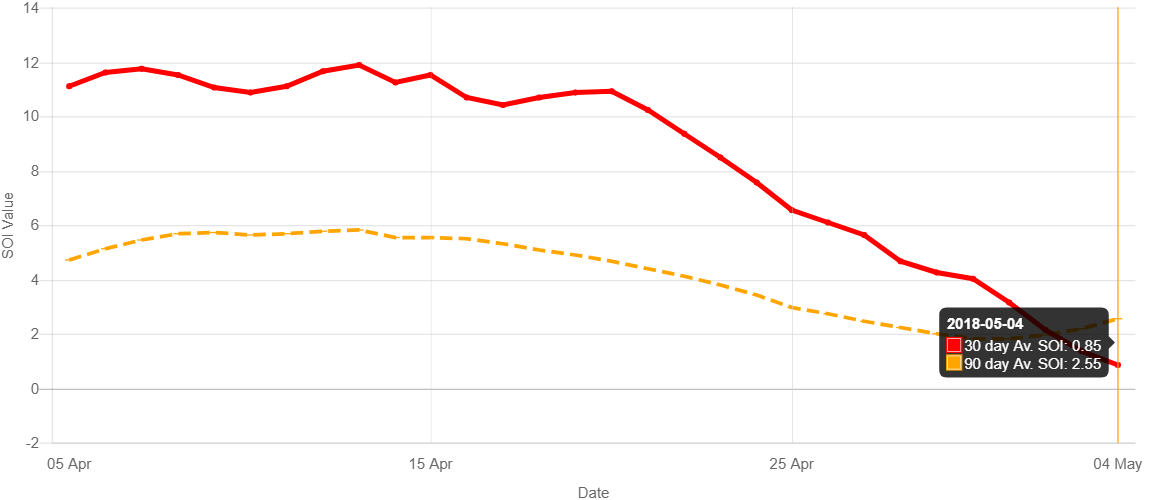
Recent (preliminary) Southern Oscillation Index values as per The Long Paddock – Queensland Government.
30 Days average SOI was +4.02 at the end of April 2018 and was +0.85 on 4th May 2018 as per The Long Paddock – Queensland Government and 90 Days average SOI was +2.55.
SOI Monthly graph up to April 2018 as per The Long Paddock – Queensland Government.
Summary by: Climate Prediction Center / NCEP Dated 30th April 2018
ENSO Alert System Status: La Niña Advisory
La Niña conditions are present.*
Equatorial sea surface temperatures (SSTs) are near-to-below average across the east-central and eastern Pacific Ocean.
La Niña is expected to transition to ENSO-neutral during the April-May, with ENSO-neutral then likely (greater than 50% chance) to continue through the Northern Hemisphere summer 2018.
As per BOM -Australia 24th April 2018
ENSO outlooks
All eight of the surveyed international climate models indicate equatorial Pacific sea surface temperatures are likely to rise further over the coming months. A neutral ENSO state is the most likely outcome for the remainder of the southern hemisphere autumn and winter.
Two models indicate central Pacific sea surface temperatures may approach El Niño threshold values during spring, however model outlooks produced during or spanning autumn have a lower accuracy than at other times of the year, and should be viewed with some caution.
(Seasons cited by BOM above are with reference to Southern Hemisphere)

Ashok Patel’s Final Note:
Using NOAA Criteria A Weak La Nina is yet in existence at the end of April 2018 with the latest 3-monthly season FMA 2018 at -0.6ºC
Last five ONI Index are OND 2017 -0.9ºC, NDJ 2018 -1.0ºC, DJF 2018 -0.9ºC, JFM 2018 -0.8ºC and FMA 2018 -0.6ºC. Since, the last consecutive 3-monthly seasonal ONI Index are less than or equal to -0.5ºC it fulfills the NOAA criteria for continuation of a weak La Nina at the end of April 2018.
La Nina event 2017-18 has officially evolved at the end of March 2018 (JFM 2018) and yet is in existence at the end of April 2018. This La Nina event is the second consecutive La Nina, the other being 2016-17 La Nina event that ended at the end of January 2017 (NDJ 2017).
Theoretically a Full Fledged El Nino event is not possible to be established during the Indian Summer Monsoon, since there are only five 3-monthly seasons left till end of September 2018, namely MAM 2018, AMJ 2018, MJJ 2018, JJA 2018 & JAS 2018, and Indian Summer Monsoon normally comes to an end by then (September end).
અશોક પટેલ ની નોંધ :
NOAA માપદંડ મુજબ 2018 એપ્રિલ આખર ના સામાન્ય ‘લા નિના’ હજુ અસ્તિત્વ માં છે.
છેલ્લા પાંચ ત્રી-માસિક સીઝન નું ONI ઈન્ડેક્સ OND 2017 at -0.9°C, NDJ 2018 at -1.0°C, DJF 2018 at -0.9°C, JFM 2018 at -0.8°C, and FMA 2018 at -0.6°C. છેલ્લું ત્રી-માસિક સીઝન નું ONI ઈન્ડેક્સ -0.5°C અથવા તેનાથી નીચે રહેલ છે. એટલે NOAA માપદંડ મુજબ 2018 એપ્રિલ આખર ના સામાન્ય ‘લા નિના’ હજુ અસ્તિત્વ માં છે.
સૈદ્ધાંતિક રીતે ભારતીય ચોમાસા દરમિયાન NOAA ના માપદંડ મુજબ વિધિવત ‘એલ નિનો’ થવાની શક્યતા નથી કારણ કે ભારત નું ચોમાસુ સપ્ટેમ્બર આખરે પૂરું થતું હોય છે અને હવે સપ્ટેમ્બર આખર સુધી ફક્ત પાંચ ત્રી-માસિક સીઝન બાકી છે, જે છે MAM 2018, AMJ 2018, MJJ 2018, JJA 2018 & JAS 2018.
All earlier updates are listed below:
Click here for Update “Full Fledged La Nina Event Has Developed At The End Of March 2018”
Click here for Update “La Nina Event 2017-18 Expected To Commence At The End Of March”
Click here for Update “Three Consecutive 3-Monthly Seasons Have Oni -0.5ºC Or Below”
Click here for Update “ENSO Neutral Conditions Prevails”
Click here for Update “ENSO Neutral Conditions Prevails With JAS 2017 ONI Index At -0.2ºC”
Click here for Update “Theoretically El Nino Not Possible During 2017”
Click here for Update “Theoretically El Nino Not Possible During The Indian Southwest Monsoon 2017”