Strong El Nino Conditions Prevails At The End Of January 2024 – However This El Nino Not Expected To Be Stronger Than 1982-83 Or 1997-98 Or 2015-16 El Nino
જાન્યુઆરી 2024 ના અંતમાં મજબૂત અલ નીનો સ્થિતિ પ્રવર્તે છે – જોકે આ અલ નીનો 1982-83 અથવા 1997-98 અથવા 2015-16 અલ નીનો જેટલો મજબૂત રહેવાની અપેક્ષા નથી
Enso Status on 10th February 2024
Ashok Patel’s Analysis & Commentary :
The classification of El Niño events, including the strength labels, is somewhat subjective and can vary among meteorological and climate agencies. There isn’t a strict rule defining the specific number of consecutive Oceanic Niño Index (ONI) values that must be 2.0°C or above to categorize an El Niño event as “Super Strong.”
In general, a “Strong” El Niño event is often characterized by ONI values reaching or exceeding +2.0°C. A “Super Strong” El Niño would typically involve sustained ONI value of +2.0°C or more. Hence for ease of understanding and comparing the strength of various “Strong” El Nino events, I propose to define an El Nino as a “Super Strong” event if three consecutive ONI index is +2.0°C or more.
A brief history of the past El Nino events with the number of consecutive ONI +2.0°C or above:
In the year 1965 the highest ONI index during that El Nino were SON +2.0°C, OND +2.0°C
In the year 1972-73 the highest ONI index during that El Nino were OND +2.1°C NDJ +2.1°C DJF
In the year 1982-83 the highest ONI index during that El Nino were SON +2.0°C, OND +2.2°C NDJ +2.2°C DJF +2.2°C
In the year 1997-98 the highest ONI index during that El Nino were ASO +2.1°C SON +2.3°C, OND +2.4°C NDJ +2.4°C DJF +2.2°C
In the year 2015-16 the highest ONI index during that El Nino were ASO +2.2°C SON +2.4°C, OND +2.6°C NDJ +2.6°C DJF +2.5°C JFM +2.1°C
ONI Data has been obtained from CPC – NWS – NOAA available here
There have been three “Super Strong” El Nino events from 1950 onwards till date. The first such event was 1982-83 “Super Strong” El Nino with 4 consecutive ONI +2.0°C or above with highest ONI of +2.2°C twice. The second “Super Strong” El Nino event was 1997-98 with five consecutive ONI +2.0°C or above with highest ONI of +2.4°C twice. The third “Super Strong” El Nino event was 2015-16 with six consecutive ONI +2.0°C or above with highest ONI of +2.6°C twice. The current forecast and analysis does not support the 2023-24 El Nino to become a “Super Strong” El Nino.
અલ નીનો ઘટનાઓનું વર્ગીકરણ, તાકાત ના વર્ગીકરણ સહિત, કંઈક અંશે અલગ અલગ રીતે થતું હોય છે અને તે હવામાન અને આબોહવા એજન્સીઓમાં અલગ પણ હોય શકે. અલ નીનો ને “સુપર સ્ટ્રોંગ” તરીકે વર્ગીકૃત કરવા માટે કેટલા સળંગ ONI ઈન્ડેક્સ 2.0°C અથવા તેથી વધુ હોવો જોઈએ તેવો કોઈ કડક નિયમ નથી.
સામાન્ય રીતે, “સ્ટ્રોંગ” અલ નીનો ઘટના માં ONI મૂલ્યો +2.0°C અથવા તેનાથી વધુ હોય છે. “સુપર સ્ટ્રોંગ” અલ નીનોમાં સામાન્ય રીતે ONI +2.0°C અથવા વધુ હોવા જોઈએ. આથી વિવિધ “સ્ટ્રોંગ” અલ નીનો ઘટનાઓ ની તાકાત સમજવામાં અને તેની સરખામણી કરવામાં સરળતા માટે, જો સતત ત્રણ ONI ઈન્ડેક્સ +2.0°C અથવા વધુ હોય તો હું અલ નીનોને “સુપર સ્ટ્રોંગ” ઈવેન્ટ તરીકે વ્યાખ્યાયિત કરવાનો પ્રસ્તાવ મૂકું છું.
ભૂતકાળની અલ નીનો ઘટનાઓનો સંક્ષિપ્ત ઇતિહાસ કે જેમાં ONI +2.0°C અથવા તેથી વધુની સળંગ સંખ્યા:
વર્ષ 1965માં અલ નિનો દરમિયાન સૌથી વધુ ONI ઇન્ડેક્સ SON +2.0°C, OND +2.0°C હતો.
વર્ષ 1972-73માં અલ નીનો દરમિયાન સૌથી વધુ ONI ઇન્ડેક્સ OND +2.1°C NDJ +2.1°C DJF હતો
વર્ષ 1982-83માં અલ નીનો દરમિયાન સૌથી વધુ ONI ઇન્ડેક્સ SON +2.0°C, OND +2.2°C NDJ +2.2°C DJF +2.2°C હતો
વર્ષ 1997-98માં અલ નીનો દરમિયાન સૌથી વધુ ONI ઇન્ડેક્સ ASO +2.1°C SON +2.3°C, OND +2.4°C NDJ +2.4°C DJF +2.2°C હતો
વર્ષ 2015-16માં અલ નીનો દરમિયાન સૌથી વધુ ONI ઇન્ડેક્સ ASO +2.2°C SON +2.4°C, OND +2.6°C NDJ +2.6°C DJF +2.5°C JFM +2.1°C હતો
1950 થી અત્યાર સુધી ત્રણ “સુપર સ્ટ્રોંગ” અલ નીનો ઈવેન્ટ્સ થઈ ચુક્યા છે. આવી પ્રથમ ઘટના 1982-83 “સુપર સ્ટ્રોંગ” અલ નીનો હતો જેમાં સતત 4 ONI +2.0°C અથવા તેથી વધુ હતા, તે પૈકી બે વખત સૌથી વધુ ONI +2.2°C હતું. બીજી “સુપર સ્ટ્રોંગ” અલ નીનો ઈવેન્ટ 1997-98 માં હતો. જેમાં સતત પાંચ ONI +2.0°C અથવા તેથી વધુ હતા, તે પૈકી બે વખત સૌથી વધુ ઓની +2.4°C હતું. ત્રીજી “સુપર સ્ટ્રોંગ” અલ નીનો ઈવેન્ટ 2015-16માં સતત છ ONI +2.0°C અથવા તેનાથી વધુ હતા. તે પૈકી બે વખત સૌથી વધુ ONI +2.6°C હતું. વર્તમાન આગાહી અને વિશ્લેષણ 2023-24 અલ નીનોને “સુપર સ્ટ્રોંગ” અલ નીનો બનવા માટે સમર્થન આપતું નથી.
ભારતીય ચોમાસ પર એલ નિનો લા નીના ની અસર:
આગળ ના 100 વર્ષ થી વધુ ની શરેરાશ પ્રમાણે એલ નિનો વર્ષ માં ભારતીય ચોમાસુ 94% રહેલ છે, જયારે લા નિના વર્ષ માં ચોમાસુ 106% રહેલ છે. ભારતીય ચોમાસા માટે વિવિદ્ધ પરિબળો પૈકી નું એલ નિનો/લા નિના ફક્ત એક પરિબળ છે. ભારતીય દક્ષિણ પશ્ચિમ ચોમાસુ નબળું રહેવાની ધારણા હતી જે 94.4% રહ્યું જે નોર્મલ ગણાય. ભારત ના અલગ અલગ વિસ્તારો ના ચોમાસા પર એલ નિનો/લા નિના ની અસર એક સરખી નથી થતી, જે હાલ રિસર્ચ નો ઠોસ વિષય છે.
Indian Monsoon & Enso relationship for India:
Based on earlier more than 100 years weather Data for Indian Summer Monsoon, The Average Rainfall in an El Nino years is 94% of LPA while in La Nina Years it has been 106 % of LPA for the whole country. Monsoon Rainfall over India had been +94.4% of LPA at the end of 30th September 2023. El Nino or La Nina may affect the Monsoon differently for different Regions of India and warrants research for concrete co-relations for each region of India if any. Performance of Southwest Monsoon 2023 over the entire Country was much better than expected.
How ONI is determined:
The ONI is based on SST departures from average in the Niño 3.4 region, and is a principal measure for monitoring, assessing, and predicting ENSO. Defined as the three-month running-mean SST departures in the Niño 3.4 region. Departures are based on a set of further improved homogeneous historical SST analyses (Extended Reconstructed SST – ERSST.v5).
NOAA Operational Definitions for El Niño and La Niña, El Niño: characterized by a positive ONI greater than or equal to +0.5ºC. La Niña: characterized by a negative ONI less than or equal to -0.5ºC. By historical standards, to be classified as a full-fledged El Niño or La Niña episode, these thresholds must be exceeded for a period of at least 5 consecutive overlapping 3-month seasons.
CPC considers El Niño or La Niña conditions to occur when the monthly Niño3.4 OISST departures meet or exceed +/- 0.5ºC along with consistent atmospheric features. These anomalies must also be forecast to persist for 3 consecutive months.
The Climate Prediction Center (CPC) is a United States Federal Agency that is one of the NECP, which are a part of the NOAA
Latest Oceanic Nino Index Graph Shows
El Nino Conditions Are Prevailing At The End Of January 2024
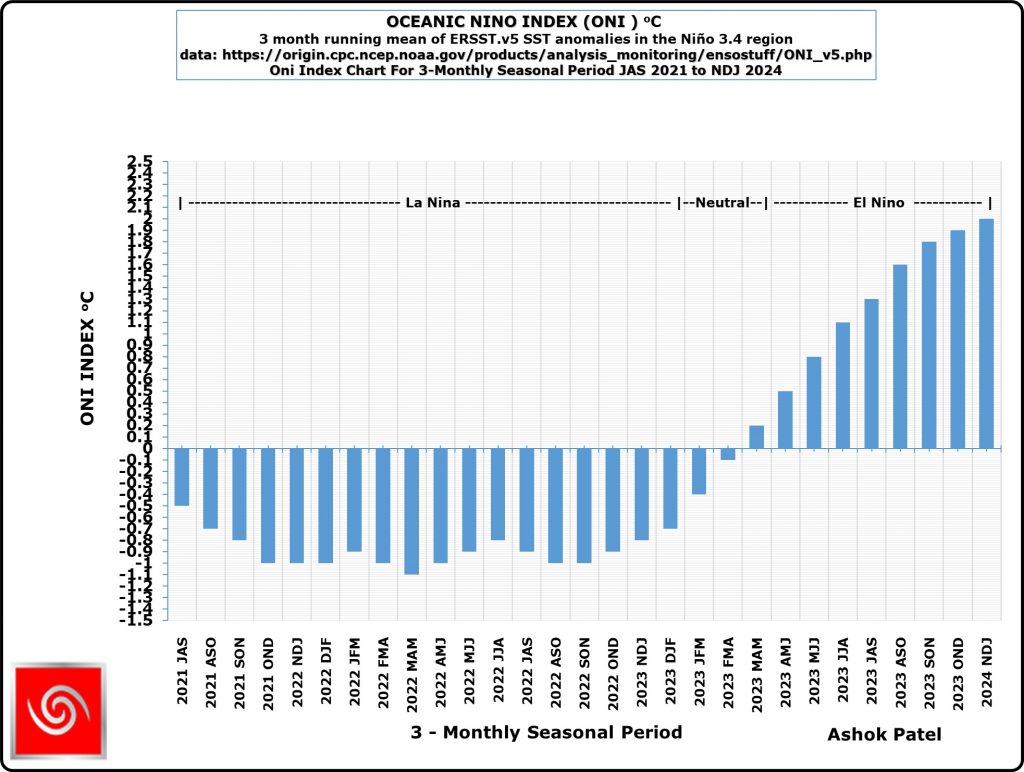
The Table below shows the monthly SST of Nino3.4 Region and the Climate adjusted normal SST and SST anomaly from July 2021. Climate Base 1991-2020. ERSST.v5
Period    Nino3.4 ClimAdjust
YR   MON  Temp.ºC Temp.ºC ANOM ºC


2021   7   26.90   27.29   -0.39
2021   8   26.32   26.86   -0.53
2021   9   26.16   26.72   -0.55
2021  10   25.78   26.72   -0.94
2021  11   25.76   26.70   -0.94
2021  12   25.54   26.60   -1.06
2022   1   25.61   26.55   -0.95
2022   2   25.88   26.76   -0.89
2022   3   26.33   27.29   -0.97
2022   4   26.72   27.83   -1.11
2022   5   26.83   27.94   -1.11
2022   6   26.98   27.73   -0.75
2022   7   26.60   27.29   -0.70
2022   8   25.88   26.86   -0.97
2022   9   25.65   26.72   -1.07
2022  10   25.73   26.72   -0.99
2022  11   25.80   26.70   -0.90
2022  12   25.75   26.60   -0.86
2023   1   25.84   26.55   -0.71
2023   2   26.30   26.76   -0.46
2023   3   27.19   27.29   -0.11
2023   4   27.96   27.83    0.14
2023   5   28.40   27.94    0.46
2023   6   28.57   27.73    0.84
2023   7   28.31   27.29    1.02
2023   8   28.21   26.86    1.35
2023   9   28.32   26.72    1.60
2023  10   28.44   26.72    1.72
2023  11   28.72   26.70    2.02
2023  12   28.63   26.60    2.02
2024   1   28.42   26.55    1.87
Indications and analysis of various International Weather/Climate agencies monitoring ENSO conditions is depicted hereunder:
Summary by: Climate Prediction Center / NCEP Dated 4th February 2024
ENSO Alert System Status: El Niño Advisory
El Niño conditions are observed.*
Equatorial sea surface temperatures (SSTs) are above average across the central and eastern Pacific Ocean.
The tropical Pacific atmospheric anomalies are consistent with El Niño.
El Niño is expected to continue for the next several seasons, with ENSO-neutral favored during April-June 2024 (73% chance).*
Note: These statements are updated once a month (2nd Thursday of each month) in association with the ENSO Diagnostics Discussion, which can be found by clicking here.
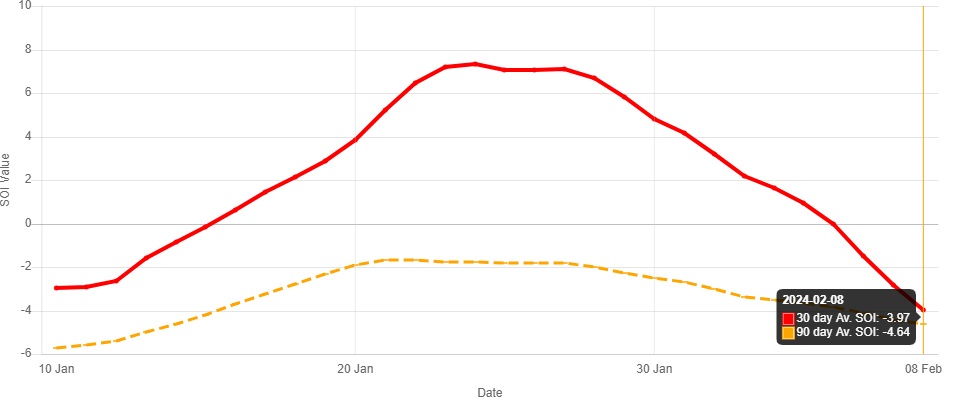
Recent (preliminary) Southern Oscillation Index values as per The Long Paddock – Queensland Government.
30 Days average SOI was 3.96 at the end of January 2024 and was -3.97 on 8th February 2024 as per The Long Paddock – Queensland Government and 90 Days average SOI was -4.64 on 8th February 2024. During January 2024 the SOI had become +3.96 and is -3.97 currently.
Southern Oscillation Index
As per BOM, Australia
The 30-day Southern Oscillation Index (SOI) for the period ending 31 January 2024 was 3.7 and was 0.7 on 4th February 2024 and is moving towards negative direction once again..
Sustained negative values of the SOI below −7 typically indicate El Niño while sustained positive values above +7 typically indicate La Niña. Values between +7 and −7 generally indicate neutral conditions.

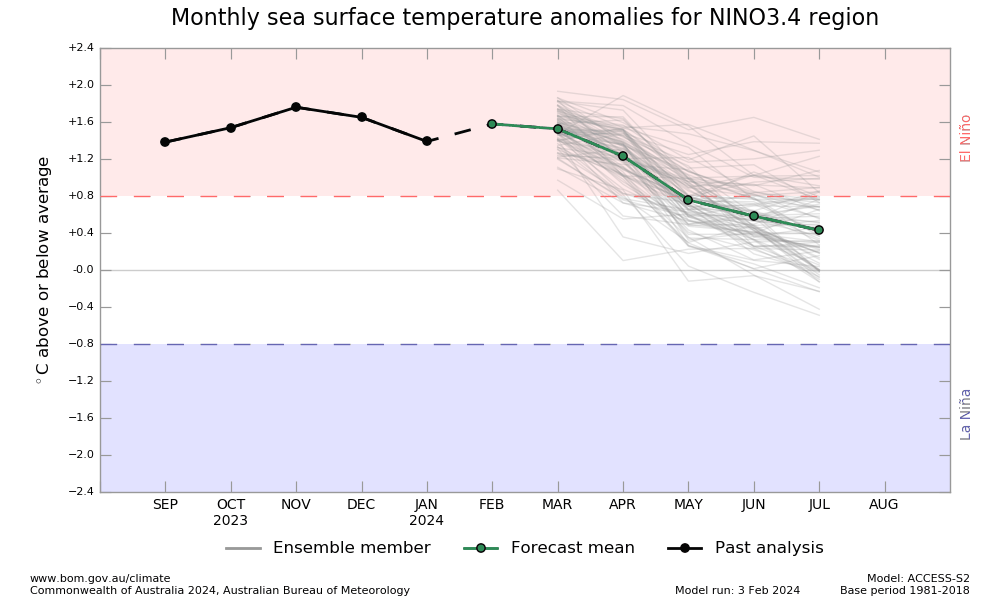
As per BOM – Australia 6th February 2024
El Niño has peaked and is declining
ENSO Outlook
Climate model outlooks suggest El Niño has peaked and is declining, indicating a return to neutral in the southern hemisphere autumn 2024. The ENSO Outlook will remain at El Niño status until this event decays, or signs of a possible La Niña appear.